Download
1 / 16
160 likes | 338 Views
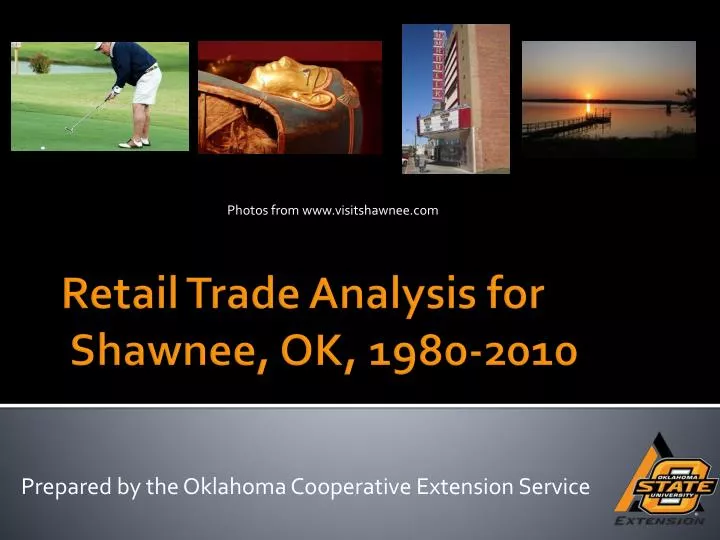
Photos from www.visitshawnee.com. Retail Trade Analysis for Shawnee, OK, 1980-2010. Prepared by the Oklahoma Cooperative Extension Service. Population for Shawnee, OK 1980-2010. Sales Tax Collections for Shawnee, OK, 1980-2010. 2.0%-3.0%.

E N D
Photos from www.visitshawnee.com Retail Trade Analysis for Shawnee, OK, 1980-2010 Prepared by the Oklahoma Cooperative Extension Service
What isTrade Area Capture? • Trade Area Capture estimates the number people that shop in your town annually. • TAC is estimated from your town’s estimated taxable sales figures obtained from the Oklahoma Tax Commission.
What is a Pull Factor? • A Pull Factor is an index calculated so that trade areas can be compared across different cities and towns. • A Pull Factor is the town’s Trade Area Capture Divided by the town’s Population. • A PF > 1.0 implies that a town is drawing in shoppers over and above its own population. • A PF < 1.0 implies that a town is not capturing the retail dollars of its own residents.
Pull Factors for Cities and Townsin Pottawatomie County, 1980-2010
Pull Factors for Shawnee & for Cities with Population 25,000-50,000
Sales Gap Analysis • Sales gap coefficients are interpreted in exactly the same way as pull factors. • The only difference is that 8 distinct retail categories are analyzed--based on SIC codes.