Estonia's Economic Turmoil: Analyzing Crises from 2000 to 2013
340 likes | 457 Views
This analysis explores Estonia's economic journey from independence in 1991 through the crises of 2000-2013. Highlighting its transition to a market-based economy and EU membership in 2004, it examines the impact of the currency board system and the adoption of the Euro in 2011. Despite having one of the highest per capita incomes in Eastern Europe, Estonia faced significant challenges during the global financial crisis, witnessing a sharp economic decline and changes in domestic demand. This overview assesses Estonia's resilience and adaptability in a volatile global market.

Estonia's Economic Turmoil: Analyzing Crises from 2000 to 2013
E N D
Presentation Transcript
Estonia 2000-2013 Another crises country
Background and History • Details of the relevant history, pertinent to its economic condition. • Position of the economy in the world, relative to others.
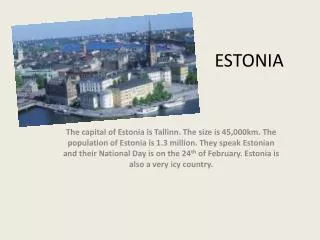
Background and History • A Baltic country, with 1.29 million population. • Independence in August 1991 from Soviet Unions. • 2004 incorporated to European Union. • Member of NATO and OECD. • January 1, 2011 adopted Euro, prior local currency was Kroons, maintained with a currency board.
Currency Board • Established early during the transition and facilitated relatively smooth transition. • Previously, ruble zone, inconvertible and hyperinflating. • Currency board in Estonian kroon: fully convertible at a fixed rate to Deutschmark (8:1. • Backed by Deutschmark reserves, and monetary base changes one-to-one with Deutschmark reserves. • With Euro in 1999, Estonia unified currency area with Euro, (later to Euro 15.6:1) • Foreign exchange inflow, kroon monetary base increases.
Economic Outcome • With the independence moved quickly to a market based economy. It has the highest per capita income in East Europe. • Instituted political, institutional and economic reforms. Strong and sustained growth followed. • Considered as High Income Country by WB, Advanced Economy by IMF. • Has one of the highest freedom indexes (press, economic, education etc..) • Per capita income = 21 200 US $ in 2012 (5 657 $ in 1993)
Estonia • Since independence, market based economy, pro-business policies. • Net inflows of FDI is 7% of GDP. (29% of GDP on average )machinery and equipment until 2005). Exports of Good&Serv. amounts to 73% of GDP between 1992-2005. • Facilitate the use of technology, internet and computers (more mobile phone subscribes than people). • Relatively high skilled labor force, low wages contribute to competitiveness. In 2004, two thirds of the young generation attend university. Public and private spending on education is 6% of the GDP. • Proximity to Nordic countries, • Main trading partners are Sweden, Finland and Germany.
Recent Policy Changes, Liberalization and Regulations What type of economy, rules… Recent policy changes such as liberalization of any sector, or market…
Recent Policy Changes, Liberalization and Regulations • Prior to crisis (2004-2007) • Free market principles, open economy and factor flexibility are the important element for this success. • Open economy trade and capital movements • FDI and foreign participation in banking sector. • EU accession and its preparations boosted the growth process. • Flat Income Tax: 21% since 1996 (initially was 26%) • Retained profits are not taxed.
Openness and small country • Openness contributes to growth through exports, as an increase in absorption. • However, small open economies are more sensitive to global and sectoral shocks and results in pronounced volatility of the output. This will have long term effects… • FDI and Trade can mitigate the external and domestic shocks, through a lower Keynesian multiplier, which explains how shocks are propagated throughout the economy.
The performance of the economy prior to the crisis • Output growth, inflation and unemployment, • Monetary Policy, interest rates, • Fiscal balances, Government budget deficit and debt, • Current account balances, etc • Labor markets
The performance of the economy prior to the crisis 2004-2007 • Fast growing economy, low unemploymen • Lower government deficit and debt, • No control of monetary policy. • Due to pegged currency can not control inflation. • Credit increase, inflated housing prices and led dominance of the construction sector, • Unemployment rate is low, especially due to construction sectors expansion.
How Was The Economy Affected by the Crises? • Which sector was affected first?, • Financial markets, • Prices, interest rates and exchange rate, • Output and employment effect, • External balance and fiscal balance,
Initial shock of the crises Q4 of 2007 • External shock was through export sector. Decline of export demand were significant. • Around the same time loan-financed real estate bubble burst, (why bubble?). • A decrease in private demand and public demand. • Consumption expenditure declined, savings increased. • Fiscal policy was pro-cyclical.
During the crisis • Estonia was one of the countries with the sharpest decline in output • 2007 2008 2009 2010 2011 2012 • 7.5% -3.6% -14.2% 2.2% 8.3% 3.2% • Brunt of the recession was felt in 2009. • Two reasons: • Small country, contraction is transmitted via exports and FDI • Previous credit expansion boosted demand led to a bubble, which collapsed with drop in housing prices.
During the crisis • Estonia was one of the countries with the sharpest decline in output • 2007 2008 2009 2010 2011 2012 • 7.5% -3.6% -14.2% 2.2% 8.3% 3.2% • Brunt of the recession was felt in 2009. • Domestic demand decline • Private sector • Private consumption, (by 19% in 2009) , salaries fell as well. (Consumption of durable goods declined (41% in 2009) • Investment and inventories declined, (-35% in 2009) • Savings increased. • Household Disposable income showed a great decline- Flexibility of the economy, • Public Sector • Pro-cyclical fiscal policy, • External demand decline
Household Income Reasons: • Credit provided by the Nordic banking systems declined (10% in total loan stock). • Tax increase, decline in pension. • Unemployment increased, decline in housing prices (40% below their peak). • New legal measures for household debt restructuring were introduced.
External sector • Free trade regime and open economy. More than 60% of the output is sold internationally. • The 70% of the exports are to EU. • Considerable downturn due to the global crises at the end of 2008 and 2009. • The annual decline in goods and services export was 11.2 % in 2009. Both the prices and the volumes declined. (Biggest decline in machinery and equipment by 1/3). • Imports declined drastically due to the recession in domestic demand (in 2009 the decline was 26.8 %).
Current Account Balance • The contraction of the imports were larger than it is in exports, hence at the height of the crises, its external balance improved and the current account was balanced in 2009.
Financial Account • Domestic deleveraging, and flows abroad in banking sector. • Drop in FDI, • Sizeable deficit in the financial sector.
Recovery Measures • Internal devaluation: (external was not viable), hence cut in nominal wages. (firms focus on efficiency and led to solid increase in productivity growth) • Fiscal Policy: Pro-cyclical • Fiscal conservatism, fiscal tightening 9% of GDP at the height of the crisis. • Fiscal consolidation: 16 % of GDP. • expenditure cut (2/3) • Cuts in defense spending, operating budget, framing subsidies, health care budget, froze pension. • Revenue increase (1/3) • Tax on tobacco, alcohol, fuel; increase VAT;
Fiscal Stance during the crises • Public sector: Pro-cyclical fiscal policy. • Rapid austerity measures; • Reliable fiscal policy was instrumental in the rapid recovery. • Government Deficit 1.7 % of GDP in 2009. • Public Sector Debt is 7% of GDP. • Government deficit improved.
Fiscal stance • This is a severe cleansing activity. The removal of the nonproductive activities. • Government debt to GDP is 12% in 2009. • 81 % in Germany and • 165 % in Greece.
Recovery Measures 3. Labor market reforms: • Build of infrastructure and transportation. • Support existing and new entrepreneurs in creating job. • Help with job seekers, training programs, internships. Labor market quality improved, flexible, accessible; Mismatch of skill still continues. EU funds were used, but not with consumption boosting purpose but with long-term
Credit conditions and banking • Estonia has a very high ratio of foreign owned banking (share of foreign owned banking assets are above 95%). This has been both positive and negative. • Prior to the crises, loans were almost twice the size of the domestic deposit base. • No need to recapitalize the banking sector. • Nordic banks are capitalized and not very connected, and that helped the resilience of the banking sector during the crises. • Bank loans declined by 17% which is a very quick deleveraging. However increase in NPL was observed.
Recovery steps • The economic fundamental in the recovery. • What are the challenges now and the future?