Download
1 / 23
230 likes | 366 Views
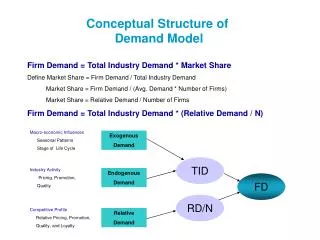
Conceptual-Empirical Water Demand Model for Investigation of Sustainable Utilization of the Calera Aquifer (Zacatecas, Mexico). Objective. To develop a site-specific, conceptual-empirical water demand model for preliminary and rapid determination of relevancy and practicality of

E N D
Conceptual-Empirical Water Demand Model for Investigation of Sustainable Utilization of the Calera Aquifer (Zacatecas, Mexico)
Objective To develop a site-specific, conceptual-empirical water demand model for preliminary and rapid determination of relevancy and practicality of alternative scenarios for land use conversion, crop type, crop coverage, irrigation amount, and irrigation efficiency to assist in the selection of most promising cropping and irrigation options for in-depth investigation.
Conceptual – Empirical < = > Subjective Not predictive, but informative
Example Questions - What is the extent that higher irrigation efficiency and crops with lower water demand can contribute towards pumping reduction? - Can a combination of improved irrigation efficiency, deficit irrigation, and change in crop type alone meet pumping goals? - How much additional irrigated-to-rainfed cropland conversion is needed to meet groundwater pumping guidelines? - What are effective and practical combinations of irrigation methods, irrigated crop type, conversion of irrigated to rain-fed cropland, and deficit irrigation?
Available data - Precipitation and temperature (F. Mojarro) - Pan evaporation (F. Mojarro) - Soil characteristics (P. Gowda) - Land categories and area (P.Gowda) - Land use and area (F. Echavarria) - Crop types, growing seasons and area (F. Echavarria) - PET for crops and rangeland ???? (P. Gowda) - Limited irrigation data (F. Echavarria) - Municipal and domestic water withdrawals (?????) - Industrial water withdrawals (?????) - Water bodies (?????)
Anticipated model capabilities
Land Categories Total watershed area: 2024 [km2] Land category: - Urban (impervious) - Barren land - Range land - Rain fed crop land - Irrigated crop land
Urban (impervious) 2.0% Barren Land 2.4% Irrigated crop land 9.7% 38.8% 47.1% Rangeland Rain fed crop land Land Categories 30% 70%
Perennial forage Cactus Pear 0.2% 0.1% Barley/Wheat/Oats (grain) Peach Oats (forage) 2.5% 6.4% Maize (grain) 15.7% 8.5% Barley (forage) 0.8% Maize (forage) & Sorghum (forage) 14.8% 51% Dry Beans Land Use: Rain fed Crop Land (summer crops)
Carrots Peach/Apples/Cactus Pear/Grapes Tomato/Green Tomato/Potatoes 1.4% 0.1% Maize (forage) 1.5% 7.3% Dry pepper Maize (grain) 27.0% 19.7% 19.7% 23.3% Green pepper Dry bean Land Use: Irrigated Crop Land(single summer crops) 7%
Winter oats – summer barley Onion - dry beans 8.5% Winter oats – summer oats 16.9% 10.2% Onion – summer oats 8.5% Winter oats – dry beans 16.9% 6.8% Onion - barley 16.9% 6.8% 8.5% Garlic - barley Garlic - dry beans Garlic – summer oats Land Use: Irrigated Crop Land(crop rotations) 3%
Water Demand Diagram for Impervious Areas PR: precipitation EV: evaporation EVP: pan evaporation SR: surface runoff LK: lake, water body RC: recharge GU: groundwater
Water Demand Diagram for Barren Land PR: precipitation EV: evaporation EVP: pan evaporation SR: surface runoff LK: lake, water body RC: recharge GU: groundwater SM: soil moisture
Water Demand Diagram for Range Land PR: precipitation EV: evaporation EVP: pan evaporation SR: surface runoff LK: lake, water body RC: recharge GU: groundwater SM: soil moisture ET: evapo-transpiration TM: temperature
Water Demand Diagram for Rain Fed Crops PR: precipitation EV: evaporation EVP: pan evaporation SR: LK: RC: recharge GU: groundwater SM: soil moisture ET: evapo-transpiration TM: temperature
Water Demand Diagram for Irrigated Crops PR: precipitation EV: evaporation EVP: pan evaporation SR: LK: RC: recharge GU: groundwater SM: soil moisture ET: evapo-transpiration TM: temperature IN: net irrigation IG: gross irrigation IR: irrigation return flow IE: evaporation losses IL: irrigation losses IV: irrigation transfer
General Flow Chart of Water Demand Calculations
Variables for Scenario Selection - Area of land category (urban; water bodies; barren land; range land; rain fed crops; irrigated crops). - Area of individual crops and crop rotations. - Net irrigation amount (deficit irrigation). - Irrigation efficiency. - Municipal and industrial water withdrawals.
Model Status - Currently operational with hypothetical data - Missing data: PET and lake information Last step: calibration and testing
Actual = Model + Error1 Scenario = Model + Error2
Actual = Model + Error1 Scenario = Model + Error2 Same model, same assumptions, same limitations, same simplifications, same biases, etc. => Error 1 ≈ Error 2
Actual = Model + Error1 Scenario = Model + Error2 Same model, same assumptions, same limitations, same simplifications, same biases, etc. => Error 1 ≈ Error 2 Difference: Actual – Scenario = Change Not predictive, but informative