Download

1 / 41
410 likes | 533 Views
This report provides a comprehensive overview of faculty, staff, and student demographics at the University of Arkansas from 1997 to 2007. It examines the enrollment figures of new freshmen, including ACT scores and high school GPAs, while also emphasizing diversity within the student body, specifically the African American demographic. Retention and graduation rates are analyzed for different cohorts, alongside trends in state funding and tuition fees. The data aims to inform stakeholders about the university's progress and areas requiring attention.

E N D
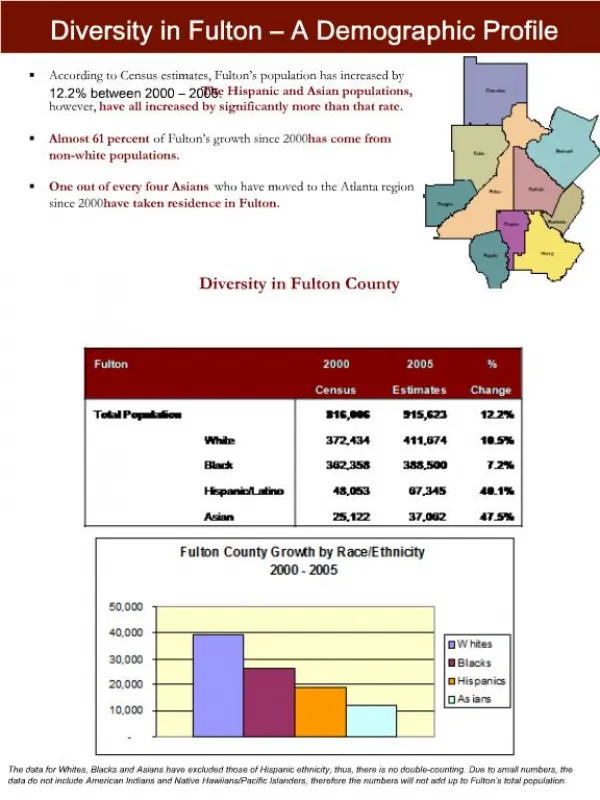
Demographic Profile Faculty, Staff, Students
Faculty Demographics *This category was not available in 1997 Faculty includes the Fayetteville Campus and the Agricultural Experiment Station only; includes Visiting, Clinical and Adjunct
Staff Demographics Staff includes Fayetteville campus only *This category was not available in 1997
Degree Seeking New Freshman ClassACT Scores Fall 1997 Fall 2007 ACT > 30 ACT 25-30 ACT 19-24 ACT < 19
Degree Seeking African American New Freshman ACT Scores Fall 1997 Fall 2007 ACT > 30 ACT 25-30 ACT 19-24 ACT < 19
Degree Seeking New Freshman ClassACT Scores Fall 2006 Fall 2007 ACT > 30 ACT 25-30 ACT 19-24 ACT < 19
Degree Seeking African American New Freshman ACT Scores Fall 2006 Fall 2007 ACT > 30 ACT 25-30 ACT 19-24 ACT < 19
Degree Seeking New Freshman High School GPA Fall 1997 Fall 2007 HSGPA >=3.75 HSGPA 3.50 – 3.74 HSGPA 3.00 – 3.49 HSGPA <3.00
Degree Seeking New Freshman High School GPA Fall 2006 Fall 2007 HSGPA >=3.75 HSGPA 3.50 – 3.74 HSGPA 3.00 – 3.49 HSGPA <3.00
Degree Seeking African American New Freshman High School GPA Fall 1997 Fall 2007 HSGPA >=3.75 HSGPA 3.50 – 3.74 HSGPA 3.00 – 3.49 HSGPA <3.00
Degree Seeking African American New Freshman High School GPA Fall 2006 Fall 2007 HSGPA >=3.75 HSGPA 3.50 – 3.74 HSGPA 3.00 – 3.49 HSGPA <3.00
1997 2005 2006 First Year Retention Rate by Ethnicity1997 Cohort vs 2005 Cohort vs 2006 Cohort
Overall Retention Rates4-Year Rolling Averages1996-2006 Cohorts
African American Retention Rates4-Year Rolling Averages1996-2006 Cohorts
Overall Graduation Rates 4-Year Rolling Averages1993 – 2003 Cohorts
African American Graduation Rates4-Year Rolling Averages1993 – 2003 Cohorts
College Going Rates Arkansas vs. National Source: AHECB Quarterly Meeting, Agenda Item 21, Aug. 3, 2007
UA Enrollment (FTE) *Note FY08 is an estimate
UA Appropriation per FTE Student *Note FY08 is an estimate
UA Appropriation per FTE Student (’89-’90 constant dollars*) * Based on HEPI inflation rates **Note FY08 is an estimate
Two Primary Sources of UA E&G Revenue:State Appropriation and Tuition & Fees
University of Arkansas - Fayetteville for FY2007 $39,763,507
University of Arkansas - Fayetteville for FY2007 $39,763,507/0.045 = $883,633,489
Endowment Market Value Among SEC Universities FY 2007 Data Not Available
Priorities & Challenges • Diversity #1 • Strengthening the Graduate Research Program • New Funding Formula • Sustainability • Strengthening the Base – the Undergraduate Program • Delivering THE MESSAGE!
Closing Thoughts • There are many reasons to feel very good about what has been accomplished • However, we dare not rest on our laurels • Much remains to be done • We must “stay the course” in our pursuit of the 2010 goals • We must be more attentive and responsive to new and emerging opportunities
????????????????????????????????????????????????????????????