Download
1 / 1
10 likes | 111 Views
Abstract.

E N D
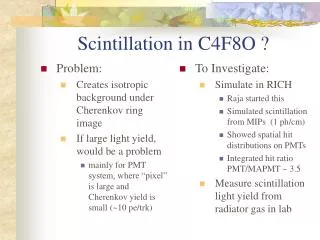
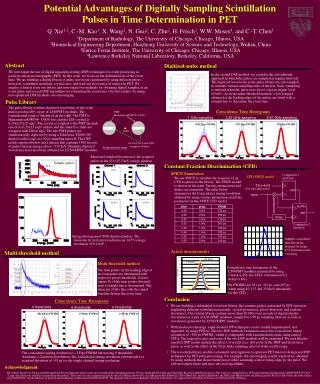
Abstract We investigate the use of digital signal processing (DSP) techniques for event processing in positron emission tomography (PET). In this work, we focus on the determination of the event time.We are building a digital library of pulse waveforms generated by using different photo-detectors, scintillator materials, crystal sizes, and read-out electronics of interest in PET. We employ a dataset from our library and investigate two methods for obtaining digital samples of an event pulse and several DSP algorithms for estimating the event time. Our first results, by using non-optimized DSP methods, are encouraging. The pulse library contains digitized waveforms of the event pulses produced by a pair of LSO/PMT modules. The experimental setup is illustrated on the right. The PMT is Hamamatsu R9800@-1300V bias and the LSO crystal is 6.25x6.25x25 mm3. The crystal is coupled to the PMT through one of its 6.25x25 mm2 surface and the other five sides are wrapped with Teflon tape. The two PMT pulses are simultaneously digitized by using a Tektronics TDS6154C digital oscilloscope at a 50 ps sampling interval. The DSP results reported below use a dataset that contains 1500 records of pulses having energy above ~350 keV. Similarly digitized waveforms have also been obtained for LYSO/MPPC modules. Coincidence Time Histograms PMT Hamamatsu R9800@-1300V 1 GHz sampling 3.33 GHz sampling 6.67 GHz sampling 592±22ps FWHM 373±10ps FWHM 325±8ps FWHM FDG Digitized-pulse method Multi-threshold method Pulse Library 6.25x6.25x25 mm3 LSO wrapped in Teflon Experimental setup Comparator 1 MAX9602 CFD SPICE model Threshold (for rejecting noise) out out input attenuation enable delay Comparator 2 MAX9602 Constant Fraction Discrimination (CFD) Conclusion • We are building a substantial waveform library that contains pulses generated by PET detectors employing different scintillation materials, crystal geometries, photo-detectors, and readout electronics. Our current library contains more than 20,000 event records of digitized pulse waveforms of a pair of LSO/PMT modules, sampled at a 50 ps sampling interval, as well as waveforms generated by LYSO/MPPC modules. • With modern technology, sophisticated DSP techniques can be readily implemented, and upgraded, by using FPGAs. The two DSP methods examined can yield a coincidence timing resolution of ~300 ps FWHM, which is comparable with measurements made using analog CFDs. The respective pros and cons of the two DSP methods will be examined. We note that the reported DSP results include the effects of crystal size, shot noise in the PMT and electronics noise, as well as the effect of the 50 ps finite sampling interval of the oscilloscope. • The waveform library enables systematic investigations to optimize PET detector design and DSP techniques for PET pulse processing. For example, the encouraging results reported are obtained by using methods that do not model noise while assuming a linear rising-edge for the pulse. We will investigate these and more advaced algorithms. Acknowledgment The authors thank Gary Drake and John Anderson for providing the digital scope and assisting in the experimental setup. We also thank Patrick LeDu and Christophe Royon for helpful discussion. The scope was supported by a UChicago Argonne internal grant, LDRD #2006-075-NO, “Large-Area Detectors with Pico-second Time Resolution.” This work was also supported in part by the ACS-IRG grant #6-9512, the NIH grants R01 EB000225, R33 EB001928, and R01 EB006085,the NSF grant PHY04-5668, the DOE grant DE FG02-06 ER 41426, the NSF (China) grant #60602028, and the Ministry of Science and Technology (China) grant #2006AA02Z333. The Argonne and Lawrence Berkeley National Laboratories are supported by the Office of Science of the Department of Energy. Potential Advantages of Digitally Sampling Scintillation Pulses in Time Determination in PET Q. Xie1,2, C.-M. Kao1, X. Wang2, N. Guo2, C. Zhu2, H. Frisch3, W.W. Moses4, and C.-T. Chen1 1Department of Radiology, The University of Chicago, Chicago, Illinois, USA 2Biomedical Engineering Department, Huazhong University of Science and Technology, Wuhan, China 3Enrico Fermi Institute, The University of Chicago, Chicago, Illinois, USA 4Lawrence Berkeley National Laboratory, Berkeley, California, USA In the second DSP method, we consider the conventional approach in which the pulses are sampled at regular intervals. The digitized waveforms in the pulse library are sub-sampled to simulate various sampling rates of interest. Such “sampling” is initiated when the pulse rises above a preset trigger level (45mV). As in the multi-threshold method, a few samples obtained at the leading edges of the pulses are fitted with a straight line to determine the event time. Mean and standard deviation of the acquired pulses in the 511±25.5 keV energy window Sample pulses ch 2 mean mean SPICE Simulation ch 1 We use SPICE to simulate the response of an CFD to pulses in the library. The SPICE model is shown on the right. Various attenuations and delays are examined. The table below summarizes the Coincidence timing resolution obtained by using various attenuation and delay parameters in the SPICE CFD model. std. dev. std. dev. Energy histogram of 9000 digitized pulses. The Gaussian fit (red curve) indicates an 14.5% energy resolution @511 keV. sample coincidence time histogram obtained by using 0.35 attenuation and 1 ns delay Actual measurements 85 keV 175 keV Multi-threshold method The time points on the leading edge of an event pulse are determined with respect to preset thresholds. A least-square fit of the time points obtained with a straight line is determined. The intercept of this line with the signal baseline defines the event time. Coincidence time histograms of the LSO/PMT modules measured by using Canberra 454 fast CFDs (attenuation=0.2, delay=1.6ns). The FWHMs are 341 ps, 313 ps, and 297 ps when using 85, 175 and 350 keV thresholds for the CFD. 350 keV Coincidence Time Histograms 4 thresholds 8 thresholds 6 thresholds 481±20 ps FWHM 353±8ps FWHM 315±7ps FWHM The coincidence timing resolution is ~315ps FWHM when using 8 thresholds. Assuming a Gaussian distribution, this coincidence timing resolution corresponds to a standard deviation of ~95 ps for the single-channel timing resolution.