Download
1 / 33
330 likes | 504 Views
The Internet survey results. In this presentation we would like to bring your attention to the results of our Internet survey, aimed at use of computers, Internet and other media. Where do you use the Internet?. At home 69 90%

E N D
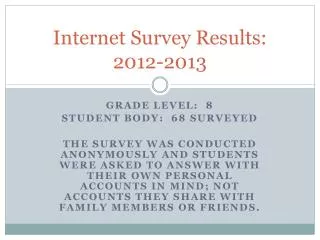
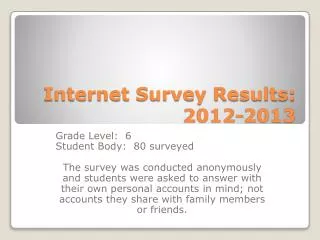
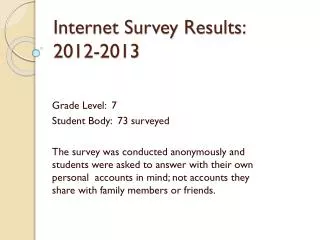
The Internet survey results • In this presentation we would like to bring your attention to the results of our Internet survey, aimed at use of computers, Internet and other media.
Where do you use the Internet? • At home 6990% • At work / at school4 5% • At internet clubs1 1% • In public places1 1% • In other places 2 3% • These results show, that home usage of the Internet has the biggest ratio of all stated possibilities. It also says much about how low the margin of using the Internet at schools or at work is.
How long have you been using the Internet and computer • For 3 and more years5673% • For 2 years1519% • For a year4 5% • For less than a year 2 3% • In this case we can undoubtelly speak about long-term usage of the Internet.
How often are you at the internet? • Few times a day49 64% • Once a day18 23% • Few times a week10 13% • Few times a month0 0% • Only seldom0 0% • We can speak about frequent usage of the Internet at as much as 64% of the respondents.
How much time do you spend at the computer? • More than two hours37 48% • 1 – 2 hours35 45% • Less than an hour5 6% • The respondents spend quite much time at their computers.
How often do you use ICQ, E-mail, or Skype at home? • Every, or nearly every day63 82% • 3 - 4 times a week9 12% • Few times a month4 5% • Seldom • I don´t use them 1 1% • The use of internet communication through ICQ, E-mail or Skype is at quite a high level and its benefits are used almost every day.
How often do you use ICQ, E-mail, or Skype at work / at school? • Every, or nearly every day7 9% • 3 - 4 a week4 5% • Few times a month18 23% • Only seldom12 16% • I don´t use them36 47% • Use of these means of communication at work or at schools is very low or zero, which also results from low usage of the Inernet at work or at schools.
How often do you use ICQ, E-mail, or Skype at Internet clubs? • Every, or almost every day 1 1% • 3 - 4 a week1 1% • Few times a month2 3% • Only seldom10 13% • I don´t use them 63 82% • The usage of the Internet and applications providing internet communication at internet clubs is at a severe regression.
How often do you use ICQ, E-mail, or Skype in public places? • Every, or nearly every day3 4% • 3 - 4 a week3 4% • Few times a month3 4% • Only seldom9 12% • I don´t use them59 77% • These result shows, that these means of communication are only at a low level used in public places, which surely is a result of limited providing of them in public places.
How often do you use ICQ, E-mail, or Skype in your mobile phone? • Every, or nearly every day 2 3% • 3 - 4 times a week4 5% • Few times a month8 10% • Only seldom11 14% • I don´t use them52 68% • Similarly, as in the previous case, the usage is low. It can be a result of low, or still quite expensive accesibility of these services on our mobile phones.
What purposes do you use the Internet for? • To help my training at school, preparing for lessons, searching for other information etc. 5673% • To read educationa web sites 1621% • To read news sites 3647% • To read sports sites 1317% • To play games1823% • To read / write forums, blogs 1823% • To watch video clips4052% • To read about new technologies and means of communication 1519% • To read sites about cars 810% • To browse sites for downloading music 3951% • To visit sites for online friendship • 1621% • To chat, use messaging 5673% • To read yelow pages, gosspis 11% • Users could check more boxes, so the total sum is higher than 100%
What information do you usually download from the Internet? • Texts 44 57% • Pictures 45 58% • Music 68 88% • Films 43 56% • Software 27 35% • The users could check more than just one box, so the total sum is higher than 100% • The Internet is at a high rate used for downloading music
Have you ever bought anything through the Internet? • Educational materials • Tickets for concerts, sport matches, or trips • Further goods from electronics shop • Music, films
Educational materials • Only have tried6 8% • Yes, but only accidentally 17 22% • Yes, I do it often12 16% • I haven´t had such experience yet42 55% • Buying of educational materials is more at accidental, or zero level.
Tickets for concerts, sport matches, or trips • Only have tried 7 9% • Yes, but only accidentally 14 18% • Yes, I do it a lot 12 16% • I haven´t had such online experience yet 44 57% • Similarly as other products, these are not regularly or at a high level bought through the Internet.
Other goods from electronics store • Only have tried 3 4% • Yes, but only accidentally 11 14% • Yes, I do it a lot 21 27% • I haven´t had such experience yet 42 55%
Music, films • Only have tried 9 12% • Yes, but only accidentally 6 8% • Yes, I do it a lot 3 4% • I haven´t had such experience yet 57 77% • Buying of this products was at the lowest level of all on our ladder.
What other media do you use? • Watching state TVs • Watching other TVs • Reading daily newspapers • Reading weekly newspapers and magazines • Reading educational magazines • Listening to news radio stations • Listening to music radio stations • Reading news on the Internet • Searching for information on the Internet
Watching state TV stations • Very often6 8% • Often 29 38% • Rarely 23 30% • Very rarely 11 14% • Never 8 10% • Watching state TV stations is at a frequent level. They enjoy a higher popularity than other TVs in our survey.
Watching other TV stations • Very often 6 8% • Often 27 35% • Rarely 27 35% • Very rarely 13 17% • Never 4 5% • They keep just behind state TV stations
Reading daily newspapers • Very often 9 12% • Often 27 36% • Rarely 20 26% • Very rarely 15 19% • never 5 6% • Reading daily newspapers is at quite a good level. In regard of weekly newspapers, they enjoy a little higher popularity.
Reading weekly newspapers and magazines • Very often 4 5% • Often 29 38% • Rarely 27 35% • Very rarely 15 19% • Never 2 3% • Similarly as daily newspapers, they enjoy quite a high popularity.
Reading educational magazines and newspapers • Very often 1 1% • Often 23 30% • Rarely 27 35% • Very rarely 17 25% • Never 9 12% • Reading educational magazines is a less popular mean of spending free time when compared to the previous subjects.
Listening to news radio stations • Very often 11 14% • Often 21 27% • Rarely 25 32% • Very rarely 13 17% • never 7 9% • News radio stations are listened to only seldom.
Listening to music radio stations • Very often 20 26% • Often 33 43% • Rarely 19 25% • Very rarely 3 4% • Never 2 3% • Music radios have, on the other hand, frequent or even very frequent listening.
Reading news on the Internet • Very often 10 13% • Often 40 52% • Rarely 18 23% • Very rarely 5 6% • never 4 5% • News on the internet are often read by as much as 52% of the respondents, which shows us its rather high popularity.
Searching for information on the Internet • Very often 34 44% • Often 35 45% • Rarely 8 10% • Very rarely 0 0% • never 0 0% • This activity has mostly often to very often margin for our respondents and enjoys the highest popularity.
What protection do you use at your computer? • Anti-virus program68 88% • Anti-spy program 2 3% • Anti-spam 1 1% • Firewall 5 6% • I don´t use any1 1% • This shows, that our respondents protect their computers quite respectably, all, but one of them, use certain means of protection. • Most frequently it is an Anti-virus program
What languages do you speak? • English 70 91% • German 36 47% • Spanish 11 14% • Italian 0 0% • Other 36 47% • Usere could check more than one box.
Are you a • Man 34 44% • Woman 43 56% • The ratio of men and women was approximately 1:1
Are you a • Teacher 9 12% • Student 68 88% • Other0 0% • Most of the quizees was from the lines of students.