Download
1 / 12
120 likes | 265 Views
GIS and Agent Based Modeling the Wretched and the Glorious. Dr. Steven Hall MOVES Institute, sbhall@nps.edu 28 February, 2013. Motivation. Many theoretical ABMs need real world ‘ GIS ’ data to be validated Many validated models need real world ‘ GIS ’ data to be useful.

E N D
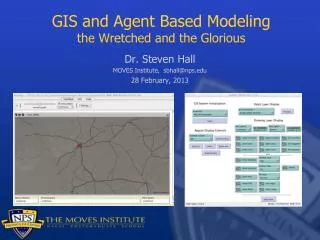
GIS and Agent Based Modelingthe Wretched and the Glorious Dr. Steven Hall MOVES Institute, sbhall@nps.edu 28 February, 2013
Motivation • Many theoretical ABMs need real world ‘GIS’ data to be validated • Many validated models need real world ‘GIS’ data to be useful • GIS (Geographical Information System) Data • [i.e. data tagged with where/when in the world it is/was ‘true’]
Challenges • Where to find the data you need • How to get it in a form you can use • How to integrate into your ABM environment • How to give your ‘users’ access to the data • How to give your ‘agents’ access to the data • (How to visualize dynamic 3D data)
Demonstration Requirements • Consent Modeling : How media influences group thinking • Demonstration Domain : Mali • Required GIS Data • Geographical Data : Land, Boundaries, Cities, Rivers, Highways … • Population Totals and Geographical Distribution • Ethnicity : language(s) spoken, access to power, conflicts …) • Cell Tower locations/ranges • Media Tower locations/ranges (including language(s) transmitted) • ABM Environment: NetLogo • Using GIS Extension • Using Hubnet Extension
Where to find the data you need • Many data sources exist (distributed around) on the web • Challenge is in finding the right/best ones • Example (vector and raster) data for Mali • Geographical Data • Borders, highways, POI, and more http://downloads.cloudmade.com/africa/western_africa/mali#downloads_breadcrumbs • Global Gazetteer http://www.fallingrain.com/world/ML/ • Population Total and Distribution • GRUMP Data http://sedac.ciesin.columbia.edu/data/sets/browse • Ethnicity • Geo-referencing of Ethnic Groups (GREG and GROWup) http://www.icr.ethz.ch/data/other/greg • Cell Towers • OpencCellid • http://www.opencellid.org/cell/list/?mcc=610 • KML Extracted by http://www.opencellid.org/cell/getInArea/?key=02a09d20ebc428118e53dd3eb9a2a21f&mcc=610&limit=800 • OpenSignal • http://opensignalmaps.com/index.php?lat=12.5865&lng=-7.9062&initZoom=11&isHeatMap=1 • Media Towers • Worldwide coverage of FM/AM/TV http://fmscan.org/index.php • What about regular maps (images) • OpenGIS WMS http://geoserver.org/display/GEOS/Available+WMS+and+WFS+servers
The GROWup (research) DB • What is this? The GROWup Public Front End offers a visualization of settlement patterns of politically active ethnic groups around the world from 1946-2009. Additionally, it provides information about ethnic groups' access to executive government power, their involvement in civil war, federal administrative units, physical elevation, nightlight data, as well as population and GDP data by area. • What is special about this? This is the only data that codes dynamic settlement patterns. The Russian intervention in Georgia in 2009, for example, led to the expulsion of Georgians from Abkhazia and South Ossetia, a change that is reflected in the data set. Another dynamic characteristic is the change in the international system. The break-up of the Soviet Union or former Yugoslavia is an example where ethnic groups now live in new states and possibly changed their settlement patterns within these new states. • Why are these specific pieces of information provided? Research on civil war has identified a number of factors that explain civil war. Exclusion from executive power, poor states, populated countries, and inaccessible terrain are all associated with an increased risk of civil war. • Why do I not see all groups that are listed? Some groups, like Whites or Blacks in the United States, virtually live across the entire territory of a state. Even if there is a larger concentration in some part of the country, it was not obvious that members of these groups were completely absent from a given area. Alternatively, some groups live exclusively in cities. In either case, a group is not assigned a settlement area. • What about cities? Big cities attract a lot of diverse people. While we have indicated whether members of a specific ethnic group live in cities they are not coded geographically. • How are ethnic groups defined? An ethnic group is defined as an identity group that defines itself or is defined by others along linguistic, religious or racial characteristics. Examples include the Basques in Spain (mainly language), the Muslims in India (mainly religion), or Whites in South Africa (mainly race or phenotype). • What does "politically relevant" mean? Politically relevant groups are those that either have representatives making political claims on behalf of their group or those that are singled out by the state through discrimination. Moreover, sometimes groups form ethnic alliances along different ethnic markers. Eritrean Muslims in Ethiopia before 1993 are a case in point. After Eritrean independence the Muslims split along linguistic lines and formed new politically relevant groups. • What is access to executive government power and why is it important? If a group makes political claims it can often best advance these in government positions. Being excluded from government positions does not only hamper the effective advancements of political demands but also implies a symbolic exclusion from state power. Exclusion from government is associated with a higher risk of civil war. Included into the executive: Monopoly (M) - Elite members hold monopoly power in the executive to the exclusion of members of other ethnic groups. Dominant (D) - Elite members of the group hold dominant power in the executive but there is limited inclusion of "token" members of other groups. Senior Partner (S) - Representatives of the group participate as senior partners in a formal or informal power-sharing arrangement. Junior Partner (J) - Representatives participate as junior partners in government. Excluded from the executive: Regional Autonomy (R) - Elite members of the group have no central power but some influence at the substate level, that is, one level below the central government. Separatist Autonomy (s) - Regional governments controlled by representatives of an ethnic category have declared their territory to be independent from the central government. Powerless (P) - Elite representatives hold no political power at either the national or the regional level without being explicitly discriminated against. Discriminated (d) - Group members are subjected to active, intentional, and targeted discrimination, with the intent of excluding them from both regional and national power.
How to get it in a form you can use • What NetLogo needs is ESRI Shape or GRID data • Or WMS for map images • Some good data you’ll find isn’t in those formats • Some are native to other GIS systems • Some are web based formats like KML • Some are simply spreadsheets or CSV files • There are a variety of open-source tools to help • GRASS is the best I’ve found • GRASS demo
How to integrate into your ABM • NetLogo provides the basic tools • NetLogo has a GIS extension … its easy to add • Its not too complicated and the documentation is pretty good • I have a Hubnet version that you can build off of • Hubnet allows you to separate the GIS controls from your App • Some key points • You have to worry about matching coordinates • NetLogo Map Coordinates, Data Coordinates/Projections • With a little finesse you can easily pan and zoom • You need to understand patch data versus drawing data • You have to be sensitive to RAM limitation issues
How to give your ‘Users’ access • Users can benefit from seeing lot’s of data • … that your agents don’t necessarily need • This is where the ‘drawing’ layer comes in • It draws on top of the agent’s patch data • It draws at the full resolution of the screen • Two basic flavors • WMS (‘paper’) maps • Extractable in real-time from the web • Can be variably transparent • Raster and Vector (point, lines, polygons) data • Drawing Layer Demo
How to give your ‘agents’ access • Your agents need GIS data to be mapped into Patches • (Of course ‘Patches’ are really ‘Agents’ already) • But the ‘mobile’ agents have ready access to Patch data • The GIS Extension supports sampling of the GIS data • It works with both raster (GRID) data and vector data • You can do fancy ‘logical’ operations as well • Of course every time you zoom or pan • The patch data has to be updated • (… unless you (foolishly?) don’t want to do that) • Patch Layer Demo
How to visualize dynamic 3D data • Just for fun (and inspiration) … • Demo how NetLogo can visualize 3D (GIS) data • … that changes during the simulation run Note: Some available GIS (like GREG Faction data) does this • Shows a dynamic heatmapof ‘cursed’ locations • That can be exploited to improve surveillance • But it would work equally well with any dynamic 3D