Download
1 / 30
300 likes | 329 Views
Explore beam diagnostics through beam strahlung monitoring, analytical concepts, and future directions in a research collaboration involving summer students and experts in the field.

E N D
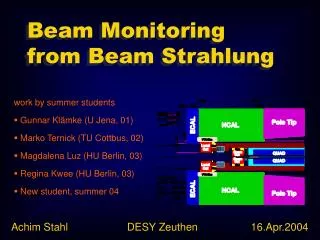
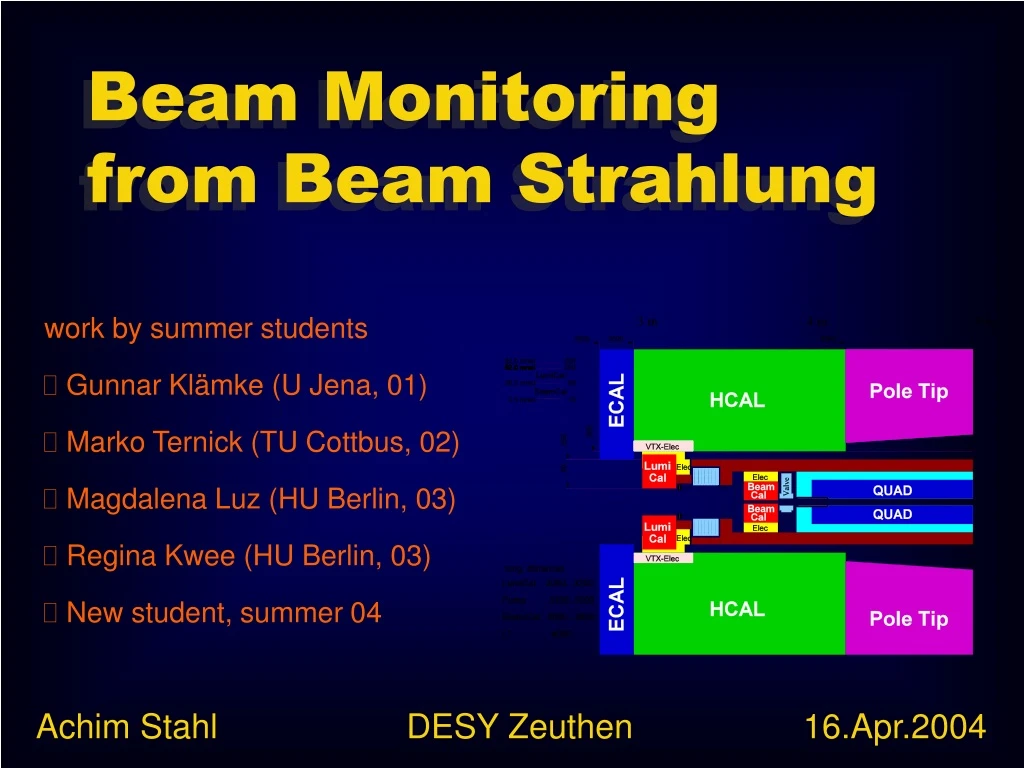
Beam Monitoring from Beam Strahlung • work by summer students • Gunnar Klämke (U Jena, 01) • Marko Ternick (TU Cottbus, 02) • Magdalena Luz (HU Berlin, 03) • Regina Kwee (HU Berlin, 03) • New student, summer 04 Achim Stahl DESY Zeuthen 16.Apr.2004
Beam Strahlung Diagnostics of bunches at IP GeV/mm2 • 3 potential sources of information • energy-distribution of pairs • number-distribution of pairs • distribution of photons • Over-simplified detector simulation • detectors subdivided into cells • sum energy impact on cells • main source of uncertainty • stat. fluctuations of beam-str. Linear approximation
D A C B Observables • total energy • first radial moment • first moment in 1/r • thrust value • angular spread • E(ring ≥ 4) / Etot • (A + D) – (B + C) • (A + B) – (C + D) • E / N forward / backward calorimeter
Taylor Matrix Observables Observables Δ BeamPar = + * nom Current Analysis Concept • Beam Parameters • determine collision • creation of beamstr. • creation of e+e- pairs • guinea-pig • Observables • characterize energy distributions in detectors • analysis program 1st order Taylor-Exp. Solve by matrix inversion (Moore-Penrose Inverse)
parametrization (polynomial) 1 point = 1 bunch crossing by guinea-pig slope at nom. value taylor coefficient i,j Slopes observable j beam parameter i
1st Results: Single Parameter Analysis
What’s new: • consolidation of code • new observable: E(ring ≥ 4) / Etot • normalization of observables O/σ • use of external measurments • first look at real bunch trains
Single Parameter Analysis Test of Linearity Range
Single Parameter Analysis weight of individual observables
Two Parameter Analysis Example: horizontal beam size Sngl Param Reso: 1.5 nm
Multi Parameter Analysis σx Δσx σy Δσy σz Δσz 0.3 % 0.4 % 3.4 % 9.5 % 1.4 % 0.8 % 1.5 % 0.9 % 0.3 % 0.4 % 3.5 % 11 % 0.9 % 1.0 % 11 % 24 % 5.7 % 24 % 1.6 % 1.9 % 1.8 % 1.1 % 16 % 27 % 3.2 % 2.1 %
Multi Parameter Analysis Test with non-nominal bunches: e- e+ nom. bunch size x: 575nm 575nm 553nm bunch size y: 5nm 7nm 5nm bunch size z: 290μm 320μm 300μm
Real Beams: first look Example of 2 observables:
Real Beams: first look Single Parameter Analysis: σx
LumiCal 1st layer: measures N all layers: measure E 3 Sources of Information • energy-distribution of pairs • number-distribution of pairs • distribution of photons up to now: only energy distribution of pairs used test: number-distribution of pairs • new observable • Npairs / Etot
Number Distribution weight of new variable
Number Distribution Example: 6-Par. Analysis roughly 10% improvement
σx = 650 nm σy = 3 nm First Look at Photons nominal setting (550 nm x 5 nm)
Conclusions: • Interesting resolutions achieved from single bunches • Multi-parameter analysis possible • Electron – Positron bunch can be separated • Not all parameters measurable Next Steps: • Include non-linear terms • understand realistic beam simulation • include photons ? impact on calorimeter design ?
The Mask • LumiCal shields detector against • back scattered beam strahlung • synchrotron radiation of final focus QUADs • neutrons from the dump
The Mask • LumiCal shields detector against • back scattered beam strahlung • synchrotron radiation of final focus QUADs • neutrons from the dump 5 cm graphits 10 cm graphits
VTX-Detector: Simulations by Karsten Büsser, Hamburg
Simulations by Karsten Büsser TPC: TDR slight increase in background ? optimization possible ? more in Paris new: 20 mrad crossing new: 0 crossing