Marketing
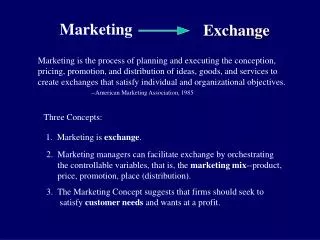
Exchange. Marketing. Marketing is the process of planning and executing the conception, pricing, promotion, and distribution of ideas, goods, and services to create exchanges that satisfy individual and organizational objectives. --American Marketing Association, 1985. Three Concepts:.

Marketing
E N D
Presentation Transcript
Exchange Marketing Marketing is the process of planning and executing the conception, pricing, promotion, and distribution of ideas, goods, and services to create exchanges that satisfy individual and organizational objectives. --American Marketing Association, 1985 Three Concepts: 1. Marketing is exchange. 2. Marketing managers can facilitate exchange by orchestrating the controllable variables, that is, the marketing mix--product, price, promotion, place (distribution). 3. The Marketing Concept suggests that firms should seek to satisfy customer needs and wants at a profit.
Market Orientations: Three Unique Characteristics • Customer Focus: An obsession with understanding customer needs and delivering customer satisfaction • Competitor Orientation: Continuous recognition of competitors’ sources of advantage, competitive position, and marketing strategies • Team Approach: Cross-functional teams dedicated to developing and delivering customers solutions
Marketing Orientation, Customer Satisfaction, and Profitability Business Profitability Customer Satisfaction And Retention Market Orientation
Customer Life Expectancy and Customer Retention (N) Average Life = 5 years thanCR = 80% Customer life expectancy increases exponentially with customer retention.
Customer Lifetime Value *Discount Rate = 10% Discount Rate = 10%
Do we want to retain every customer? • Is there a case for Outsourcing Customers? • What about Spinners with AT&T • What about “movers and shakers” with the baby bells? • There are times when we should jettison unprofitable customers or customer segments. • When?
1 AIRCOMM Customer Retention Tree(1000 customers surveyed) Satisfied Customers 67% 3,350,000 Retained 74,250 Retained 8,250 Lost 313,500 Retained 1,254,000 Lost 1,262,500 New customers Retained 90% Complain 5% Lost 10% Dissatisfied Customers 33% Customer Base 5,000,000 Retained 20% Did Not Complain 95% Lost 80% New Customers 25.5%
1 AIRCOMM Customer Retention Customer Retention = Retained Customers/Customer Base = (3,350,000+74,250+313,500)/5,000,000 =3,737,500/5,000,000 = .75
2 AIRCOMM’s Average Customer Life Expectancy A customer retention of 75% translates into an average customer life of four years. 1 1 1 Customer Life = = = 4 years = 1-Customer Retention 1-.75 .25
2 AIRCOMM: NPV of customer • It costs $250 to acquire a new customer. • During the first year, a new customer produces $150 of revenue and • $50 in margin. The cost of retention is $50. Thus in the first year, • AirComm breaks even. • In years 2 and 3, the average AirComm customer produces $400 in • revenue and $250 in margin. The average cost of customer retention • is still $50, so AirComm generates $200 in profit each year. • In year 4, the average customer becomes dissatisfied. During this year, • the average margin per customer drops to $100 as dissatisfied customers • reduce their usage to an average of $200. AirComm spends $100 in • customer retention efforts. The net result is a zero profit in year 4. • Based on the net cash flow produced each year, an NPV of $51.80 is produced • over a four-year customer life (DR = 12%). • NPV = (-$250 x 1.000) + ($0 x .893) + ($200 x .797) + ($200 x .712) + ($0 x .636) • = -$250.00 + $0 + $159.40 + 142.40 + $0 • = $51.80
3 AIRCOMM: Improve customer satisfaction from 67% to 77% • With a customer base of 5 million, an improvement in customer satisfaction • from 67% to 77% would result in 3,850,000 satisfied and retained customers. • This level of customer satisfaction reduces the percent dissatisfied from • 33% to 23%. • This results in 51,750 dissatisfied customers who complained and were • retained and 218,500 dissatisfied customers who did not complain but • were retained. • Overall, the number of retained customers increased to 4,120,250. For a • customer base of 5 million, this is a customer retention rate of 82.4%. Satisfied and retained 5,000,000 x .77 = 3,850,000 Dissatisfied, complain, retained 5,000,000 x .23 x .05 x .90 = 51,750 Dissatisfied, don’t complain, retained 5,000,000 x .23 x .95 x .20 = 218,500 Total Customers Retained 4,120,250 Customer Retention = 4,120,250/5,000,000 = .824
Components of a Market Orientation Marketing Knowledge Business Profitability & Growth Marketing Leadership Market Orientation Customer Retention CustomerSatisfaction Employee Retention Service Quality EmployeeSatisfaction Employee Productivity
Market-Based Performance • Market Versus Financial Performance
Financial Performance Gross Profit Net Profit (before taxes)
Marketing Performance Metrics: External Measures of Market Performance Marketing Profitability: Profitability measure of a marketing strategy
Relative Index where 100 is equal to competition, > 100 ahead of competition and < 100 behind competition.
Contribution Analysis Unit Contribution: The difference between unit price and unit variable cost. Total Contribution: The amount available to the firm to cover (or contribute to) fixed costs after variable costs have been deducted from total revenue.
Break-Even Analysis Total Revenue or Total Cost Total revenue Profit Total Cost Break-even point Variable Cost Fixed costs Loss BEV Unit Volume Total Revenue = Total Cost Price x BEV = Fixed cost + Unit variable cost (BEV) BEV = Fixed cost Price – Unit variable cost BEV = Fixed cost Unit contribution • Sensitivity analysis • Market size
Break-Even Analysis Example: A manufacturer plans to sell a product for $5.00. The unit variable costs are $2.00. The fixed costs assigned to the product are $30,000. How many units must be sold to break even? $30,000 $5-$2 = 10,000 units BEV = Total Revenue = Total Cost Price x BEV = Fixed cost + Variable cost (BEV) BEV = Fixed cost Price – Unit variable cost BEV = Fixed cost Unit contribution
Net Marketing Contribution (NMC) How do marketing strategies contribute to overall profits of a business? Sales Revenue Cost of Goods Sold Gross Profit Operating Expenses Net Profit (before taxes) = Traditional View
Net Marketing Contribution: Santa Fe Sportsware Product Line P1 Marketing and Sales Expenses are traditionally a part of Sales, General & Administration (SG&A) in most annual reports.
Fundamental Market-Based Strategies and Profitable Growth 10 million 10 percent $50 $5,000,000 $40
Market Productivity = Net Marketing Contribution Marketing Budget Marketing Productivity
AVOIDING MARKETING MYOPIA • Marketing Myopia is management’s failure to recognize the scope of its business. • To avoid marketing myopia, companies must broadly define organizational goals toward consumer needs. © PhotoDisc
The Diffusion Process • Describes how potential customers learn about new products, try them, and • adopt or reject them. • Rogers (1962) categorized adopters on the basis of relative time of adoption of • the innovation based on individual differences. People differ markedly in their • readiness to try new products.
34% Late majority 34% Early majority 13 1/2% Early adopters 16% Laggards Time of adoption Adopter Categorization of the Basis of Relative Time of Adoption of Innovations Deliberate, adopt before the average person, but are not leaders. Skeptical, adopt after the majority of people have tried it. Opinion leaders, adopt new ideas early but carefully. Tradition bound, suspicious of change. Venturesome, willing to try new ideas at some risk. 2 1/2% Innovators
34% Late majority 34% Early majority 13 1/2% Early adopters 16% Laggards The Chasm 2 1/2% Innovators Time of adoption innovations
Product Adoption Categories Innovators Early Adopters Early Majority Late Majority Laggards 2.5% 13.5% 34% 34% 16% Tech. Enthusiasts Visionaries Pragmatists Conservatives Skeptics • Appreciate the benefits • of new technology • Match technology • to opportunity • Motivated by future • opportunities • Intuitive • Support revolution • Contrarian • Break from pack • Risk taker • Seek what is • possible • Key to opening market • segment • Tech. Junkie • Aggressively pursue • technology products • Appreciate • technology for its • own sake • May purchase for • the pleasure of • exploring the new • product’s properties • Realize potential • Gatekeepers • Winning them over • is key because their • endorsement reassures • the market that the • product works • Wait and see • Motivated by • present problems • Driven by practicality • Analytic • Want to see well- • established references • Conformist • Stay with the herd • Risk manager • Pursue what is probable • Winning their business • is key to profits and • growth • Wait, wait, wait until • new technology • becomes established • standard • Less willing to become • technologically • competent • Motivated by • tradition • Support status quo • Stay in center of • herd • Risk adverse • Winning their business • is highly profitable • Do not want anything • to do with the new • technology • Only buy is when the • technology is buried • so deep inside another • product that they don’t • know it is there. • Not worth pursuing
Sales & profits ($) Introduction Growth Maturity Decline Time Product Life Cycle