Download
1 / 29
290 likes | 509 Views
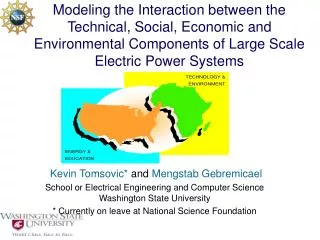
Modeling the Interaction between the Technical, Social, Economic and Environmental Components of Large Scale Electric Power Systems. Kevin Tomsovic* and Mengstab Gebremicael School or Electrical Engineering and Computer Science Washington State University

E N D
Modeling the Interaction between the Technical, Social, Economic and Environmental Components of Large Scale Electric Power Systems Kevin Tomsovic* and Mengstab Gebremicael School or Electrical Engineering and Computer Science Washington State University * Currently on leave at National Science Foundation
Outline of Presentation • Some Observations and Questions • When should we expect power plant construction • Expansion of WSU’s Work in Several Areas • Collaboration in Research • System Dynamics • Overall Study Approach • Study Bench Marks • Actual Model in Simulink • Conclusions and future works Third US-Africa Research and Education Collaboration Workshop Abuja, Nigeria, December 13-15, 2004
Some Observations and Questions • Deregulation has been met in every case by unintended consequences, some reaching the level of a crisis • The electric power industry has historically gone through periods of boom and bust cycles. • Is it the fundamental nature of generation investment and technology that leads to these cycles and crises? • Do transmission system limits and reliability considerations exacerbate the difficulty of predicting policy outcomes? • How are the cycles influenced by the new market policies? • How do various incentives programs (e.g. capacity payment, tradable green certificates) impact the planning process? • Can regulatory policies and new engineering approaches relieve these cycles and resulting societal costs? Third US-Africa Research and Education Collaboration Workshop Abuja, Nigeria, December 13-15, 2004
Disparate System Views • System dynamics research shows the tendency towards boom/bust cycles from generation investment and construction permit policies. • Engineers understand the operating limits of the transmission system. • Economists know market structures that generally lead to more efficient economic behavior from suppliers. • Policy makers may set goals based on limited understanding of operations, e.g., 20% renewables in 20 years. But how do these areas interact? Third US-Africa Research and Education Collaboration Workshop Abuja, Nigeria, December 13-15, 2004
When should we expect power plant construction to appear? • Just in time to cause the market to clear at an average annual price that matches the total cost of a new power plant? • In waves of boom and bust? • Textbook answer: • Construction will appear just in time to keep market prices at the cost of a new entrant. • The answer from other industries (agriculture, mining, real estate)? Third US-Africa Research and Education Collaboration Workshop Abuja, Nigeria, December 13-15, 2004
Construction will be in waves of boom and bust Ref: Land Values and Real Estat Construction in Chicago traced from Hoyt (1933) Third US-Africa Research and Education Collaboration Workshop Abuja, Nigeria, December 13-15, 2004
Lessons from Other Industries • Pay attention to physical factors, such as long lead times for permitting and construction • Include the behavioral factors, such as the tendency to discount the construction in progress • Expect psychological factors to shape investor behavior and our discussion of boom & bust: Third US-Africa Research and Education Collaboration Workshop Abuja, Nigeria, December 13-15, 2004
26 $ per MWH Long Lead Times Behavioral Factor Third US-Africa Research and Education Collaboration Workshop Abuja, Nigeria, December 13-15, 2004
Boom and Bust in Power Systems Price spikes reappear in 2007 Price Implications of “Base Case” Simulation from Nov 2001 Third US-Africa Research and Education Collaboration Workshop Abuja, Nigeria, December 13-15, 2004
Expansion of WSU’s Work in Several Areas • Long term investment dynamics • System security • Existing models do not show impact of transmission systems • System security in operations • Transmission planning processes • Market models and investment behavior • Bidding behavior • Impact of congestion on bidding behavior • More sophisticated market rules • New generation technologies (e.g., dispersed generation units) • Environmental impacts Third US-Africa Research and Education Collaboration Workshop Abuja, Nigeria, December 13-15, 2004
Research PlanDevelopment of models to provide improved inputs to the system dynamics simulation • Transmission systems • Simplified network models appropriate for studying longer term trends with the inclusion of all important effects (regional bottlenecks, etc.). More detailed than simple reserves. • Transmission planning processes under various economic structures. • Markets • Consider impact of market rules and supplier gaming • Environmental Impact • Role of renewable targets and other related policies Third US-Africa Research and Education Collaboration Workshop Abuja, Nigeria, December 13-15, 2004
Cooperation with West African Researchers • Development of models appropriate for West African Power Pool • Study impact of weakly meshed transmission systems • Modifications for behavioral, regulatory and environmental differences • Emphasis on Matlab models rather than Vensim Collaboration in Research Third US-Africa Research and Education Collaboration Workshop Abuja, Nigeria, December 13-15, 2004
System Dynamics • Originated by applying the concepts of feedback theory to the study of industrial systems • Models are one of many tools to help in the study of chaos and complexity • Models are constructed to help understand why patterns (growth, decay, and oscillations) occur • Designed for general understanding, not point prediction • Emphasizes high level intuitive construction of models. • No explicit representation of dynamic equations. • Awkward implementation of numerical algorithms (e.g., market clearing processes) Third US-Africa Research and Education Collaboration Workshop Abuja, Nigeria, December 13-15, 2004
System DynamicsModeling Issues for Generation Investment • Investors expected prices several years ahead • Time lags in construction of facilities • Investor behavior (bounded rationality) • External economic factors and other unknowns • Reserve margin base decision • More information at WSU Website: http://www.wsu.edu/~forda click research on boom and bust in the competitive electric industry
Software Issues and Model Development • System dynamics • Emphasizes high level intuitive construction of models. • No explicit representation of dynamic equations. • Awkward implementation of numerical algorithms (e.g., market clearing processes) • Software tools (Stella,Vensim) • Powerful tools for scenario studies • Fast methods to build models • Not open to sophisticated numerical calculations • Engineering • Emphasizes physical and precision of models at potentially the expense of higher level insights. • Explicit representation of dynamics. • Sophisticated computational methods. • Variety of analytical methods • Software tools (Matlab) • Extensive libraries of computational tools • Model building labor intensive calculations. Third US-Africa Research and Education Collaboration Workshop Abuja, Nigeria, December 13-15, 2004
System Dynamics - For Engineering • Simulink • Is an interactive tool for modeling, simulating, and analyzing dynamic systems. • Extensive libraries of computational tools • Model building labor intensive • Is an extension to MATLAB which uses an icon-driven interface for the construction of a block diagram representation of a process. • The tool choice for control system design, signal processing, communication, and other simulation applications • Explicit representation of dynamics. • Sophisticated computational methods. • Variety of analytical methods • The block diagram represent the actual math (Different blocks for different math expressions) • Emphasizes physical and precision of models at potentially the expense of higher level insights. Third US-Africa Research and Education Collaboration Workshop Abuja, Nigeria, December 13-15, 2004
Simulink Model for Construction of New Combined Cycle Plants Third US-Africa Research and Education Collaboration Workshop Abuja, Nigeria, December 13-15, 2004
Overall Study Approach • Follow some suggested steps of modeling • Get acquainted with the system • Be specific about the dynamic problem • Draw the causal loop diagram • Run the model to get the reference model • Conduct sensitivity analysis • Test the impact of policies • Scenario analysis – various assumptions • Price forecasts • Economic growth • Weather variables • Investor behavior variations • Reserve margins • Verification from historical data Third US-Africa Research and Education Collaboration Workshop Abuja, Nigeria, December 13-15, 2004
Benchmark Systems - WECC • Five regions • North West Power Pool • Rocky Mountain Power Area • Arizona - New Mexico -Southern Nevada Power • Northern California • Southern California. • Resources, load growth, and so on, vary by area • No transmission constraints within regions • Network parameters derived from DC network load flow model Third US-Africa Research and Education Collaboration Workshop Abuja, Nigeria, December 13-15, 2004
Benchmark Systems – WAPP (cont)14 Countries of West Africa – proposed West African Power Pool Third US-Africa Research and Education Collaboration Workshop Abuja, Nigeria, December 13-15, 2004
Simulink Model for WAPP(RM base investment) Third US-Africa Research and Education Collaboration Workshop Abuja, Nigeria, December 13-15, 2004
Simulink Model for WAPP(Price based investment) Third US-Africa Research and Education Collaboration Workshop Abuja, Nigeria, December 13-15, 2004
Simulink ModelS function: Price and generation computation • Cost Function - linear marginal cost function (incremental cost): - Average full costs for will be an integral over the marginal cost function: Third US-Africa Research and Education Collaboration Workshop Abuja, Nigeria, December 13-15, 2004
S function: (cont) • The total cost is given by • Matlab formulation of quadratic function, as expected by the “quadprog” function • The linear terms (vector b) can also be expressed as: Third US-Africa Research and Education Collaboration Workshop Abuja, Nigeria, December 13-15, 2004
S function: (cont) • Network Constraints: - DC load flow which • relates injected nodal real powers, voltage phase angles and real power flows in network elements (branches). • assumes that voltage magnitudes are all equal to 1 p.u. • assumes that the network is lossless (branch is represented only by its equivalent reactance ) - The first set of equations relates injected nodal real powers and nodal voltage phase angles -The B' matrix is derived from the bus-admittance (inverse of bus-impedance) • quadratic, symmetric, for a network with n nodes has dimension [n-1 x n-1]. • bii – sum of all inversed reactances of the branches connected to node i • bij – negative sum of all inversed reactances of the branches connected between nodes i and j; Third US-Africa Research and Education Collaboration Workshop Abuja, Nigeria, December 13-15, 2004
S function: (cont) • Network Constraints (cont) - The second set of equations relates real power flows in network branches Pflow and nodal voltage phase angles - To solve for power flows first find phase angles: - The power flow equations can be written as: - The inequality constraints imposed by the network elements’ capacities are: Third US-Africa Research and Education Collaboration Workshop Abuja, Nigeria, December 13-15, 2004
Simulation Results (price, generation) Third US-Africa Research and Education Collaboration Workshop Abuja, Nigeria, December 13-15, 2004
Simulation Results (construction on display) Construction (30 month simulation Third US-Africa Research and Education Collaboration Workshop Abuja, Nigeria, December 13-15, 2004
Conclusions and Future work • Engineering model: Detailed studies – Computationally intense • Power flow model for transmission constraints • Full market model with possibility of strategic bidding for energy and reserves • Use of analytical models for investor behavior that lose some of their intuitive feel • Investigation of stability analysis methods for developed models (initially using linearization • As pointed out the model is for learning, and improved understanding of the interaction between technical, social, economical, and environmental factors in power plant investment • So far the reference mode (boom and bust cycle) of construction is not attained • Different test scenarios are going to be conducted • Validation of the model using historical data is expected Third US-Africa Research and Education Collaboration Workshop Abuja, Nigeria, December 13-15, 2004