Download
1 / 24
240 likes | 351 Views
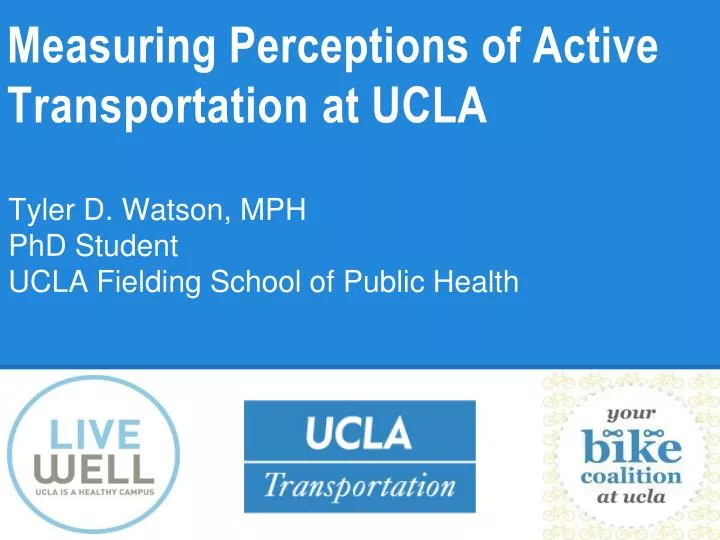
Measuring Perceptions of Active Transportation at UCLA. Tyler D. Watson, MPH PhD Student UCLA Fielding School of Public Health. UCLA Commuter Perceptions Survey. Designed for general commuter population 11 questions Electronic random distribution to 1,800 faculty, staff, students

E N D
Measuring Perceptions of Active Transportation at UCLA Tyler D. Watson, MPH PhD Student UCLA Fielding School of Public Health
UCLA Commuter Perceptions Survey • Designed for general commuter population • 11 questions • Electronic random distribution to 1,800 faculty, staff, students • Home address within 5 mile radius of campus • n = 240
Primary Transportation Mode *Other: skateboard, scooter, motorcycle, shuttle
Barriers to Walking *Other: physical ability, schedule, environment
Barriers to Bicycling *Other: ability to ride a bike, age/health status, bike ownership, hygiene/appearance
Walking Incentives *Other: shorter distance, affordable housing near campus, more time, family obligations, other safety concerns
Bicycling Incentives *Other: lack of bike access (e.g. cost, bike sharing), other safety concerns (e.g. less traffic and smog, more bicyclists)
How safe do you feel walking on campus? Completely Safe Extremely Unsafe How safe do you feel walking on the peripheryof campus? Completely Safe Extremely Unsafe
How safe do you feel bicycling on campus? Completely Safe Extremely Unsafe How safe do you feel bicycling on the peripheryof campus? Completely Safe Extremely Unsafe
Open-Ended • “Having a dedicated bike lane would increase my desire to bike to work.” • “...consistent bike lanes instead of ones that only last for a few blocks at a time.” • “...need a bike path that is protected with a physical barrier.”
UCLA Medical Centers Bicycle Access Survey • Proposed access route between medical centers (~4.5 miles) • 9 questions • Pediatrics and family practice email lists • Paper surveys at pediatrics grand rounds • n = 75
My commute is inconvenienced by traffic-related issues. I support the proposed bicycle-friendly access route. How likely would you be to use the bicycle route?
Which bicycling improvements, if any, would increase the likelihood that you would bicycle on this route?
Additional Comments • “I often bring my bike to cycle to RR when I have to commute and find it much easier than driving, but safety is an issue. • “While I would be excited to have the opportunity to bike between SM and RRMC, it would still scare me. There would have to be a huge emphasis on cars not taking out cyclists!!!” • “I stopped biking due to the difficulty of the Wilshire-405 cross section. It feels very unsafe… If safer, I would love to bike to work!”
UCLA Strathmore Bike Counter November 22, 2013
Field Survey • Wayfinding • Increased signage for directions • Info on multiple building sides • Bike parking • Better signage & visibility • Closer to building entrances • Install in high-demand areas • Pedestrians • Increase crosswalk visibility • Resolve bike-ped areas