Other Trigonometric Functions
Chapter 4 Trigonometric Functions. 4.6. Other Trigonometric Functions. 4.6. 1. MATHPOWER TM 12, WESTERN EDITION. The Reciprocal Functions. The graphs of y = tan q and the reciprocal trigonometric functions are periodic functions, but they differ from the

Other Trigonometric Functions
E N D
Presentation Transcript
Chapter 4 Trigonometric Functions 4.6 Other Trigonometric Functions 4.6.1 MATHPOWERTM 12, WESTERN EDITION
The Reciprocal Functions The graphs of y = tanq and the reciprocal trigonometric functions are periodic functions, but they differ from the sinusoidal functions y = sinq and y = cosq in that they have restrictions on their domains. Recall the reciprocal functions: The transformations that will be applied to the reciprocal functions follow the same rules as those of the primary ratios. y = acsc b(x + c) + d 4.6.2
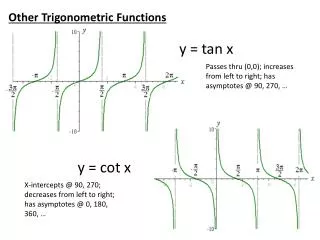
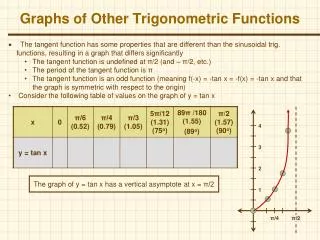
Graphing the Tangent Function Period: p Asymptotes: Domain: all real numbers Range: 4.6.3
Graphing the Cotangent Function 1. Draw vertical asymptotes. 2. Plot the points at y = 1 and -1. 3. Sketch the cotangent function. 4.6.4
Graphing the Cotangent Function [cont’d] p Period: Asymptotes: Domain: Range: all real numbers 4.6.5
Graphing the Cosecant Function 1. Draw the vertical asymptotes. 2. Plot the points at y = 1 and -1. 3. Sketch the cosecant function. 4.6.6
Graphing the Cosecant Function [cont’d] 2p Period: Asymptotes: Domain: Range: -1 ≥ y ≥ 1 4.6.7
The Cosecant Function Graph y = 2csc x. Graph y = csc 2x. y = 2csc x y = csc x For y = csc2 x: For y = 2csc x: 2p Period: Period: Asymptotes: Asymptotes: Domain: Domain: Range: Range: -1 ≥ y ≥ 1 -2 ≥ y ≥ 2 4.6.8
Graphing the Secant Function 1. Draw the vertical asymptotes. 2. Plot the points at y = 1 and -1. 3. Sketch the secant function. 4.6.9
Graphing the Secant Function [cont’d] 2p Period: Asymptotes: Domain: -1 ≥ y ≥ 1 Range: 4.6.10