Download
1 / 1
10 likes | 116 Views
Integrating observation-based hydrometeorological products into land surface models for a realistic representation of terrestrial processes on a global scale. Research focuses on understanding and predicting variability in energy and water cycles using advanced assimilation techniques.

E N D
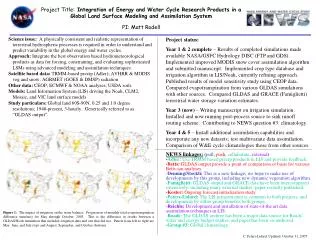
Project Title: Integration of Energy and Water Cycle Research Products in a Global Land Surface Modeling and Assimilation System PI: Matt Rodell Science issue: A physically consistent and realistic representation of terrestrial hydrospheric processes is required in order to understand and predict variability in the global energy and water cycles. Approach: Integrate the best observation based hydrometeorological products as data for forcing, constraining, and evaluating sophisticated LSMs using advanced modeling and assimilation techniques. Satellite based data: TRMM-based precip (Adler); AVHRR & MODIS veg and snow; AGRMET (GOES & DMSP) radiation Other data: CEOP; ECMWF & NOAA analyses; USDA soils Models: Land Information System (LIS) driving the Noah, CLM2, Mosaic, and VIC land surface models Study particulars: Global land 60S-90N, 0.25 and 1.0 degree resolutions; 1948-present, 3-hourly. Generically referred to as “GLDAS output”. Project status: Year 1 & 2 complete – Results of completed simulations made available NASA/GSFC Hydrology DISC (FTP and GDS). Implemented improved MODIS snow cover assimilation algorithm and submitted manuscript. Implemented crop type database and irrigation algorithm in LIS/Noah, currently refining approach. Published results of model sensitivity study using CEOP data. Compared evapotranspiration from various GLDAS simulations with other sources. Compared GLDAS and GRACE (Famiglietti) terrestrial water storage variation estimates. Year 3 (now) – Writing manuscript on irrigation simulation. Installed and now running post-process source to sink runoff routing scheme. Contributing to NEWS question #3: climatology. Year 4 & 5 – Install additional assimilation capabilities and incorporate any new datasets; test multivariate data assimilation. Comparison of W&E cycle climatologies those from other sources. NEWS linkages:(pull, push, collaborate, external) -Adler: Use TRMM based precip products in LIS and provide feedback. -Betts: GLDAS output provide a point of comparison or basis for various Betts-ian analyses. -Denning/Stockli: This is a new linkage; we hope to make use of developments by this group, including new dynamic vegetation algorithm. -Famiglietti: GLDAS output and GRACE data have been intercompared extensively, including many external studies; paper recently published. -Koster: Ongoing forecast initialization study. -Peters-Lidard: The LIS infrastructure is common to both projects, and developments by either group benefits both groups. -Reichle: Development and installation of state-of-the art data assimilation techniques in LIS. -Roads: The GLDAS archive has been a major data source for Roads’ water and energy budget studies, and paper has been co-authored. -Group #3: Global climatology. Figure 1: The impact of irrigation on the water balance. Progression of monthly total evapotranspiration difference (mm/mo) for May through October, 2003. This is the difference in results between a GLDAS/Noah simulation that included irrigation data and one that did not. Panels from left to right are May, June, and July (top) and August, September, and October (bottom). C. Peters-Lidard, Updated: October 31, 2007