Download
1 / 21
210 likes | 327 Views
CONSTRAINING AEROSOL SOURCES AND PROCESSES USING FIELD OBSERVATIONS AND MODELS. Daniel J. Jacob. with Tzung-May Fu 1 , Jun Wang 2 , Easan E. Drury 3. and funding from EPRI, NSF, NOAA, NASA. 1 now asst. prof. at Honk Kong Polytechnic University 2 now asst. prof. at University of Nebraska

E N D
CONSTRAINING AEROSOL SOURCES AND PROCESSES USING FIELD OBSERVATIONS AND MODELS Daniel J. Jacob with Tzung-May Fu1, Jun Wang2, Easan E. Drury3 and funding from EPRI, NSF, NOAA, NASA 1 now asst. prof. at Honk Kong Polytechnic University 2 now asst. prof. at University of Nebraska 3 still trying to get out
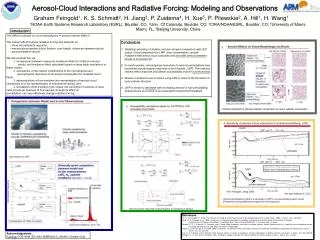
CONVENTIONAL MODELING OF ORGANIC AEROSOL 20 K OH, O3,NO3 SOG SOA VOC secondary formation POA isoprene terpenes oxygenates… alkanes alkenes aromatics… alkenes aromatics oxygenates… 20 100 30 700 50 vegetation fuel/industry open fires fuel/industry open fires VOC EMISSION PRIMARY EMISSION Global sources in Tg C y-1 (standard version of GEOS-Chem model)
…BUT THESE MODELS UNDERESTIMATE OBSERVATIONS simulated/observed ratios from recent measurement campaigns Volkamer et al. [2006] Discrepancy worsens as air masses age; suggests irreversible SOA source missing from the models
IRREVERSIBLE DICARBONYL UPTAKE BY AQUEOUS AEROSOL glyoxal methylglyoxal Chamber AMS experiments of glyoxal uptake by Liggio et al. [JGR 2005] Organic aerosol mass growth with time Inferred reactive uptake coefficient g • median g = 2.9x10⁻³ observed for aqueous surfaces; evidence for oligomerization • similar g observed for methylglyoxal on acidic surfaces [Zhao et al. ES&T 2006]
POSSIBLE MECHANISMS FOR DICARBONYL SOA FORMATION GAS AQUEOUS Schweitzer et al. [1998] Kalberer et al. [2004] Liggio et al. [2005a,b] Hastings et al. [2005] Zhao et al. [2006] Loeffler et al. [2006] glyoxal Oligomers oligomerization oligomerization H* ~ 105 M atm-1 Altieri et al. [2006, 2008] oxidation methylglyoxal OH Organic acids Ervens et al. [2004] Crahan et al. [2004] Lim et al. [2005] Carlton et al. [2006, 2007] Warneck et al. [2005] Sorooshian et al. [2006, 2007] H* ~ 103 M atm-1
GLYOXAL/METHYLGLYOXAL FORMATION FROM ISOPRENE 6% 25% GEOS-Chem mechanism based on MCM v3.1 Fu et al. [JGR, submited] molar yields
Including reactive uptake by aq. aerosols + clouds with g =2.9x10⁻³ [Liggio et al., 2005] GLOBAL GLYOXAL BUDGET IN GEOS-Chem (biomass burning) t = 2.9 h Global SOA formation of 6.4 Tg yr-1 (1.0 in clear sky + 5.4 in cloud); compare to 16 Tg yr-1 from terpenes/isoprene by semivolatile mechanism Fu et al. [JGR, submited]
GLOBAL METHYLGLYOXAL BUDGET IN GEOS-Chem Including reactive uptake by aerosols and clouds with g =2.9x10⁻³ (biomass burning) t = 1.6 h Global SOA formation of 16 Tg yr-1 (2 in clear sky + 14 in cloud); compare to 16 Tg yr-1 from terpenes/isoprene by semivolatile mechanism Fu et al. [JGR, submited]
MODEL COMPARISON TO IN SITU OBSERVATIONS Continental boundary layer (all northern midlatitudes summer) Continental free troposphere Marine boundary layer Glyoxal Methylglyoxal Indication of a missing marine source in the model Fu et al. [JGR, submited]
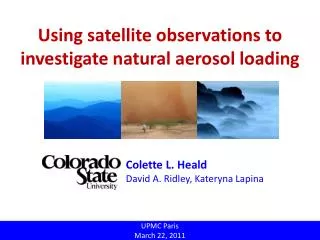
SCIAMACHY SATELLITE OBSERVATION OF GLYOXAL • General spatial pattern reproduced over land, SCIAMACHY is 50% higher than model • SCIAMACHY sees high values over oceans correlated with chlorophyll: unidentified marine source? 100 pptv glyoxal in marine boundary layer would yield ~1 mg C m-3 SOA; could contribute to observed OC aerosol concentrations in marine air Fu et al. [JGR, submited]
SIMULATION OF WSOC AEROSOL OVER EASTERN U.S. Water-soluble OC (WSOC) aerosol observations by Rodney Weber (GIT) from NOAA aircraft during ICARTT campaign out of Portsmouth, NH (Jul-Aug 04) biomass burning plumes excluded Observed Boundary layer data (<2 km) Model w/ dicarbonyl SOA added Model w/ standard SOA IMPROVE (surface) ICARTT Model hydrophilic primary OA model w/ dicarbonyls w/out dicarbonyls Fu et al., in prep.
CORRELATIONS OF FREE TROPOSPHERIC WSOC WITH OTHER VARIABLES MEASURED ON NOAA AIRCRAFT Observed Model with dicarbonyl SOA Model without dicarbonyl SOA • WSOC is observed to correlate with • toluene and methanol (anthro+bio?) • sulfate (aqueous-phase production?) • alkyl nitrates (photochemistry?) • Model does not reproduce observed WSOC variability but does better with correlations, particularly when dicarbonyl SOA is included (sulfate, alkyl nitrates) Fu et al., in prep.
EXPLAINING PERSISTENT OBSERVATIONS OF NEUTRALIZED SULFATE IN UPPER TROPOSPHERE H2SO4 DMS, SO2 NH3 Is NH3 retained or released when cloud droplets freeze? efficient scavenging of aerosol, HNO3, NH3, some SO2 by liquid droplets Precipitation removal DMS, SO2 Sulfate aerosol NH3 HNO3 Lab data indicate NH3 retention efficiency of 10-4-10-2; , would allow efficient release of NH3 to neutralize upper tropospheric aerosol
IMPLICATIONS FOR SULFATE NEUTRALIZED FRACTION (X) AND AEROSOL PHASE Annual zonal mean GEOS-Chem model results in an ammonium-sulfate simulation including hysteresis of phase transitions and NH3 retention efficiency of 0.05 upon cloud freezing Upper tropospheric sulfate is mostly neutralized and solid! Implications for atmospheric chemistry, cirrus formation… Wang et al. [JGR, submitted]
INTERPRETING SATELLITE AEROSOL DATA: HOW DO WE GO BEYOND PRETTY PICTURES? MODIS 0.47 mm aerosol optical depth (June 2003) How can we use satellite data to better quantify aerosol sources and processes through comparison to models? Need 1. improved surface reflectance data over land 2. model simulation of top-of-atmosphere reflectance in satellite field of view
IMPROVING MODIS SATELLITE RETRIEVALS OF AEROSOL OPTICAL DEPTHS OVER LAND MODIS measures top-of-atmosphere (TOA) reflectance in several wavelength channels • Interpretation of TOA reflectance in terms of AOD requires assumptions on surface reflectance, aerosol optical properties • Use TOA reflectance at 2.13 mm (transparent atmosphere) to derive surface reflectance • MODIS operational algorithm relies on general assumptions for 0.47/2.13 and 0.65/2.13 surface reflectance ratios; we improve by deriving those locally using lower envelope in scatterplots of 0.65 vs. 2.13 MODIS TOA reflectance data • MODIS operational algorithm relies on general categories for aerosol optical properties; improve by using local GEOS-Chem model data 0.47 mm 0.65 mm 2.13 mm AEROSOL SURFACE Drury et al. [JGR, subnmitted]
GEOS-Chem SIMULATION OF MODIS TOP-OF-ATMOSPHERE REFLECTANCE (JUL-AUG 2004) 0.65 vs. 2.13 mm TOA reflectance 0.65/2.13 surface reflectance ratio 2.13 mm TOA reflectance GEOS- Chem 0.65 mm AOD (AERONET In circles) GEOS- Chem 0.65 mm single- scattering albedo Simulated 0.65 mm TOA reflectance Drury et al. [JGR, submitted]
IMPROVED AOD RETRIEVAL OVER CENTRAL/WESTERN U.S. by fitting model TOA reflectances to MODIS observations MODIS vs. AERONET 0.47 mm AODs (Jul-Aug 2004) AERONET MODIS (collection 5) MODIS (this work) MODIS (collection 4) Drury et al. [JGR, submitted]
Two deployments: April (Fairbanks) and June-July (Cold Lake, Alberta) NASA/ARCTAS 2008 AIRCRAFT CAMPAIGN TO THE ARCTIC Four research themes: (1) transport of mid-latitudes pollution to Arctic, (2) boreal forest fires, (3) aerosol radiative forcing, (4) chemical processes DC-8: in situ chemistry and aerosols Ceiling 37 kft, range 4000 nmi, endurance 9 h Payload: O3, H2O, CO, CO2, CH4, NOx and HOx chemistry, BrO, mercury, NMVOCs, halocarbons, SO2. HCN/CH3CN, actinic fluxes, aerosol composition, aerosol mass and number concentrations, aerosol physical and optical properties, remote ozone and aerosol P-3: radiation and in situ aerosols Ceiling 30 kft, range 3800 nmi, endurance 8 h Payload: optical depth, radiative flux, radiance spectra, aerosol composition, black carbon B-200: aerosol remote sensing and CALIPSO validation Ceiling 32 kft, range 800 nmi, endurance 3.5 h Payload: High Spectral Resolution Lidar (HSRL) Research Scanning Polarimeter (RSP)
ARCTAS Science Theme 3: Aerosol radiative forcing CALIPSO clouds and smoke Arctic haze MISR true-color fire plume C. Trepte, LaRC R. Kahn, JPL • Satellite capabilities: • UV/Vis/IR reflectances (Cloudsat, • MODIS, MISR, OMI) • multi-angle sensing (MISR) • lidar (CALIPSO) • Aircraft added value: • detailed in situ aerosol characterization • remote sensing of radiances, fluxes • BRDFs • What is the regional radiative forcing from Arctic haze, fire plumes? • How does this forcing evolve during plume aging? • What are the major sources of soot to the Arctic? • How does soot deposition affect ice albedo?
Nominal DC-8, P-3 tracks B-200 operation ranges ARCTAS SPRING DEPLOYMENT • Deployment period: April 1-21 • About 70 flight hours for each aircraft • Primary base: Fairbanks. Secondary bases: Barrow (B-200), Thule (DC-8, P-3) • Several flights to involve collaboration with ISDAC