Download
1 / 23
250 likes | 681 Views
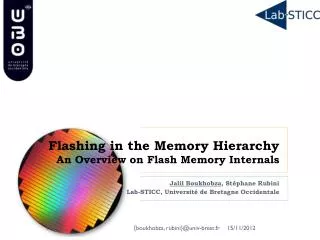
Threshold Voltage Distribution in MLC NAND Flash: Characterization, Analysis, and Modeling. Yu Cai 1 , Erich F. Haratsch 2 , Onur Mutlu 1 , and Ken Mai 1. DSSC, ECE Department, Carnegie Mellon University LSI Corporation. Evolution of NAND Flash Memory. Aggressive scaling MLC technology.

E N D
Threshold Voltage Distribution in MLC NAND Flash: Characterization, Analysis, and Modeling Yu Cai1, Erich F. Haratsch2, Onur Mutlu1, and Ken Mai1 • DSSC, ECE Department, Carnegie Mellon University • LSI Corporation
Evolution of NAND Flash Memory • Aggressive scaling • MLC technology Increasing capacity Acceptable low cost High speed Low power consumption Compact physical size E. Grochowski et al., “Future technology challenges for NAND flash and HDD products”, Flash Memory Summit 2012
Challenges: Reliability and Endurance • P/E cycles (required) Complete write of drive 10 times per day for 5 years (STEC) > 50k P/E cycles • P/E cycles (provided) A few thousand E. Grochowski et al., “Future technology challenges for NAND flash and HDD products”, Flash Memory Summit 2012
Solutions: Future NAND Flash-based Storage Architecture Raw Bit Error Rate Memory Signal Processing BER < 10-15 Noisy Error Correction • Read voltage adjusting • Data scrambler • Data recovery • Shadow program • BCH codes • Reed-Solomon codes • LDPC codes • Other Flash friendly codes Need to understand NAND Flash Error Patterns/Channel Model Need to design efficient DSP/ECC and smart error management
NAND Flash Channel Modeling Write (Tx) Read (Rx) Noisy NAND Simplified NAND Flash channel model based on dominant errors Read Write Additive White Gaussian Noise Time-variant Retention Cell-to-Cell Interference • Neighbor page program • Erase operation • Program page operation • Retention
Testing Platform USB Board PCI-e Board HAPS-52 Motherboard Virtex-5 FPGA (NAND Controllers) Flash Board Flash Chip
Characterizing Cell Threshold w/ Read Retry Erased State Programmed States • Read-retry feature of new NAND flash • Tune read reference voltage and check which Vth region of cells • Characterize the threshold voltage distribution of flash cells in programmed states through Monte-Carlo emulation #cells REF1 REF2 REF3 P1 P2 P3 0100 Vth i-2 i-1 i i+1 i+2 0V Read Retry 00 01 11 10
Programmed State Analysis P3 State P2 State P1 State
Parametric Distribution Learning • Parametric distribution • Closed-form formula, only a few number of parameters to be stored • Exponential distribution family • Maximum likelihood estimation (MLE) to learn parameters Distribution parameter vector Observed testing data Likelihood Function Goal of MLE: Find distribution parameters to maximize likelihood function
Distribution Exploration Distribution can be approx. modeled as Gaussian distribution P1 State P2 State P3 State
Noise Analysis • Signal and additive noise decoupling • Power spectral density analysis of P/E noise • Auto-correlation analysis of P/E noise Flat in frequency domain Approximately can be modeled as white noise Spike at 0-lag point in time domain
Independence Analysis over Space • Correlations among cells in different locations are low (<5%) • P/E operation can be modeled as memory-less channel • Assuming ideal wear-leveling
Independence Analysis over P/E cycles • High correlation btw threshold in same location under P/E cycles • Programming to same location modeled as channel w/ memory
Cycling Noise Analysis As P/E cycles increase ... • Distribution shifts to the right • Distribution becomes wider
Cycling Noise Modeling Mean value (µ) increases with P/E cycles Exponential model Standard deviation value (σ) increases with P/E cycles Linear model
SNR Analysis • SNR decreases linearly with P/E cycles • Degrades at ~ 0.13dB/1000 P/E cycles
Conclusion & Future Work • P/E operations modeled as signal passing thru AWGN channel • Approximately Gaussian with 22% distortion • P/E noise is white noise • P/E cycling noise affects threshold voltage distributions • Distribution shifts to the right and widens around the mean value • Statistics (mean/variance) can be modeled as exponential correlation with P/E cycles with 95% accuracy • Future work • Characterization and models for retention noise • Characterization and models for program interference noise
Hard Data Decoding • Read reference voltage can affect the raw bit error rate • There exists an optimal read reference voltage • Optimal read reference voltage is predictable • Distribution sufficient statistics are predictable (e.g. mean, variance) f(x) g(x) f(x) g(x) Vth Vth v0 v1 vref v’ref v0 v1
Soft Data Decoding • Estimate soft information for soft decoding (e.g. LDPC codes) • Closed-form soft information for AWGN channel • Assume same variance to show a simple case g(x) f(x) log likelihood ratio (LLR) Sensed threshold voltage range Vth v0 v1 vref High Confidence High Confidence Low Confidence
Non-Parametric Distribution Learning • Non-parametric distribution • Histogram estimation • Kernel density estimation • Summary • Pros: Accurate model with good predictive performance • Cons: Too complex, too many parameters need to be stored Kernel Function Volume of a hypercube of side h in D dimensions Count the number of K of points falling within the h region Smooth Gaussian Kernel Function
Probability Density Function (PDF) P1 State P2 State P3 State • Probability density function (PDF) of NAND flash memory estimation using non-parametric kernel density methodology