Download

1 / 0
0 likes | 97 Views
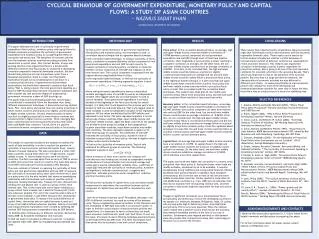
Explore the cyclical nature of government spending, monetary policy, and capital movements in Asian countries. This study delves into the intricate relationships between these economic factors, shedding light on their impact on the region's financial dynamics. By analyzing trends and patterns, valuable insights can be gained to enhance understanding and inform policy decisions in the realm of fiscal and monetary management in Asia.

E N D