Download
1 / 15
150 likes | 258 Views
Visualizing pattern from cross risk factors scenario information . About me…. Sai -Ming(Simon) Law Majored in Math at KSU, Georgia 2 nd Year, Master’s in Applied Statistics Passed: Exam P and FM Interned w/ Pacific Life Insurance Co. (Summer 2012 ).

E N D
Visualizing pattern from cross risk factors scenario information
About me… • Sai-Ming(Simon) Law • Majored in Math at KSU, Georgia • 2nd Year, Master’s in Applied Statistics • Passed: Exam P and FM • Interned w/ Pacific Life Insurance Co. (Summer 2012)
About the project I worked on… Goals: • Visually present cross risk factors scenario information • 2D & 3D plots • Automate the input /output process • Overlay scenario graphs with associated severity of outcomes • Outline pattern, “hot spots” in the scenarios where severity tends to be high or low (EC)
About this talk… • How to use R from within Excel • How to automate the input/output process
How to use R from within Excel • Install RExcel • http://homepage.univie.ac.at/erich.neuwirth/php/rcomwiki/doku.php?id=wiki:how_to_install • Enable Macro and Developer Ribbon • Go to C:\Program Files (x86)\RExcel\xls • Run the Macro, RExcelAddinAutoInstall • Check References, RExcelVBAlib, in a Macro Window
How to use R from within Excel • About macros in Excel • a series of commands and functions that are stored in a Microsoft Visual Basic module • can be run whenever you need to perform the task. • Video Demostration • http://rcom.univie.ac.at/RExcelDemo/
How to automate the input/output process Goals: • Visually present cross risk factor scenario information • 2D & 3D plots • Automate the input /output process • Overlay scenario graphs with associated severity of outcomes • Outline pattern, “hot spots” in the scenarios where severity tends to be high or low (EC)
How to automate the input/output process Tasks: • Read in Scenario Information ( a big data set) • Excel Visual Basic Application • Error Checking • Manipulate the data • R • Apply bucketing algorithm • Summarize data • Create Plot • Transport plots • R Excel
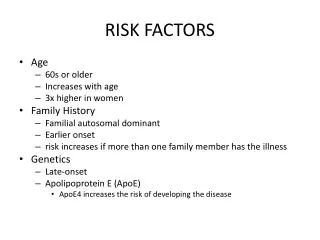
PL: SWAP 10Y x EQUITY S&P x CREDIT • Scenario frequency findings • Correlation • Edges • Clusters
PL: SWAP 10Y x EQUITY S&P x CREDIT • Outcome severity findings • Dark (losses) vs. light (gains) • Credit & interest rates have highest impact • PL’s “perfect storm” scenario
PL: SWAP 10Y x EQUITY S&P x CREDIT Frequency vs. Severity • “Blind spots” • Frequency clusters are trivial spots in severity
IIP: SWAP 10Y x SWAP 1Yx CREDIT Frequency vs. Severity • SWAP rates have high correlation • Credit dominates
Special Thanks… • Dr. Feldman • Benson Chen