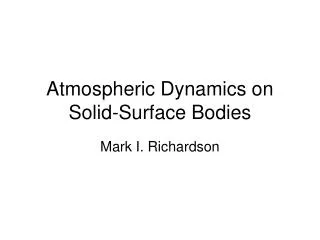
Solid Wheel on Hard Surface
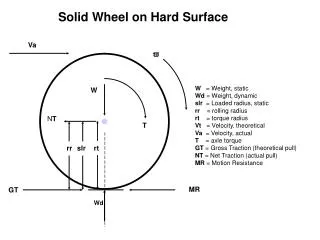
Solid Wheel on Hard Surface. Va. v. W = Weight, static Wd = Weight, dynamic slr = Loaded radius, static rr = rolling radius rt = torque radius Vt = Velocity, theoretical Va = Velocity, actual T = axle torque GT = Gross Traction (theoretical pull)

Solid Wheel on Hard Surface
E N D
Presentation Transcript
Solid Wheel on Hard Surface Va v W = Weight, static Wd = Weight, dynamic slr = Loaded radius, static rr = rolling radius rt = torque radius Vt = Velocity, theoretical Va = Velocity, actual T = axle torque GT = Gross Traction (theoretical pull) NT = Net Traction (actual pull) MR = Motion Resistance W NT T rr slr rt MR GT Wd
Soft Wheel on Hard Surface Va v W = Weight, static Wd = Weight, dynamic slr = Loaded radius, static rr = rolling radius rt = torque radius Vt = Velocity, theoretical Va = Velocity, actual T = axle torque GT = Gross Traction (theoretical pull) NT = Net Traction (actual pull) MR = Motion Resistance W NT T rr slr rt MR GT Wd eh
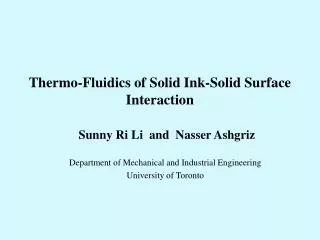
Deformable Wheel on Soft Surface Va v W = Weight, static Wd = Weight, dynamic slr = Loaded radius, static rr = rolling radius rt = torque radius Vt = Velocity, theoretical Va = Velocity, actual T = axle torque GT = Gross Traction (theoretical pull) NT = Net Traction (actual pull) MR = Motion Resistance W NT T rr slr rt ev Ground Line MR GT eh Wd
Belt Drive W = Weight, static Wd = Weight, dynamic slr = Loaded radius, static rr = rolling radius rt = torque radius Vt = Velocity, theoretical Va = Velocity, actual T = axle torque GT = Gross Traction (theoretical pull) NT = Net Traction (actual pull) MR = Motion Resistance v Va W1 W3 W2 W4 W5 NT T slr rr rt Dh Ground Line GT MR eh Wd
TRACTOR/BELT DRIVE DYNAMIC WEIGHT DISTRIBUTION When Starting with 60 % Static Front Weight 60 0.40 With Dh/Wb = 0.20 58 0.42 56 0.44 Draft Angle Dl/Wb = 0.30 0 54 0.46 Dynamic Balance Ratio 5 52 0.48 10 50 0.50 Dynamic Balance, % Front 48 0.52 20 Dh 46 0.54 Draft Angle 44 0.56 42 0.58 Wb Dl 40 0.60 0 0.1 0.2 0.3 0.4 0.5 0.6 Vehicle Traction Ratio
JD8400T TOTAL Mass =11,800 kg BELT = Goodyear 400 mm Surface = Plowed & settled soil 7/19/96 120 100 80 60 Drawbar Pull, kN 40 20 0 -0.05 0.00 0.05 0.10 0.15 0.20 0.25 0.30 0.35 0.40 Travel Reduction Ratio
Nebraska Test Drawbar Pull Comparison Ballasted and Unballasted 30000 CAT 45 Ballasted JD 8400 MFWD Ballasted 25000 CAT 45 Unballasted 20000 Drawbar Pull, lbs JD 8400 MFWD Unballasted 15000 10000 5000 0 0 2 4 6 8 10 12 14 16 Travel Reduction, %
Nebraska Test Vehicle Traction Ratio Comparison Ballasted and Unballasted 1.20 1.00 0.80 CAT 45 0.60 Vehicle Traction Ratio, VTR (pull / weight) JD 8400 MFWD 0.40 0.20 0.00 0 2 4 6 8 10 12 14 16 Travel Reduction, %
Nebraska Test Vehicle Traction Ratio Comparison With VTR as Independent Variable 16 Cat 45 Unballasted 14 “Slip Happens!” That is, Slip depends upon pull. The pull related term, NTR, GTR, VTR should be the independent variable 12 10 Cat 45 Ballasted 8 Travel Reduction, % 6 4 2 0 0.00 0.20 0.40 0.60 0.80 1.00 1.20 Vehicle Traction Ratio, VTR (pull/weight)
GENERALIZED TRACTION RELATIONSHIPS Based upon Brixius Traction Equation 1.00 Gross Traction Ratio, GTR 0.90 Tractive Efficiency Ratio, TE 0.80 Net Traction Ratio, NTR 0.70 0.60 0.50 Traction Performance Ratio 0.40 0.30 Travel Reduction Ratio = (1-Va/Vt) 0.20 Motion Resistance Ratio 0.10 = GTR - NTR 0.00 0.00 0.10 0.20 0.30 0.40 0.50 0.60 0.70 0.80 0.90 1.00 Net Traction Ratio, NTR
TRACTION LOSSES Velocity 1.00 0.90 Va / Vt = Velocity Ratio 0.80 0.70 Va = Actual Velocity 0.60 Vt = Theoretical Velocity 0.50 Traction Performance Ratio 0.40 0.30 Travel Reduction Ratio = (1-Va/Vt) 0.20 0.10 0.00 0.00 0.10 0.20 0.30 0.40 0.50 0.60 0.70 0.80 0.90 1.00 Net Traction Ratio, NTR
TRACTION LOSSES Pull 1.00 0.90 Pull Ratio = NTR / GTR 0.80 0.70 0.60 0.50 Traction Performance Ratio 0.40 0.30 Motion Resistance Ratio 0.20 = GTR - NTR 0.10 0.00 0.00 0.10 0.20 0.30 0.40 0.50 0.60 0.70 0.80 0.90 1.00 Net Traction Ratio, NTR
TRACTION LOSSES Overall 1.00 Velocity Ratio = Va / Vt Pull Ratio = NTR / GTR 0.90 0.80 Tractive Efficiency 0.70 Ratio 0.60 Traction Performance Ratio Maximum Efficiency Point 0.50 0.40 0.30 Travel Reduction Ratio = (1-Va/Vt) 0.20 Motion Resistance Ratio = GTR - NTR 0.10 0.00 0.00 0.10 0.20 0.30 0.40 0.50 0.60 0.70 0.80 0.90 1.00 Net Traction Ratio, NTR
TRACTION DATA PLOT with Regression and Loss Curves Tire = Goodyear 20.8R42 DT/DT710 Dual Surface = Lon's Tilled (seeded) 6/6/96 1.00 Velocity Ratio = Va / Vt 0.90 Pull Ratio = NTR / GTR 0.80 0.70 Tractive Efficiency 0.60 Gross Traction Ratio Traction Performance Ratio 0.50 0.40 SLIP Travel Reduction Ratio 0.30 0.20 0.10 Motion Resistance Ratio 0.00 0.00 0.10 0.20 0.30 0.40 0.50 0.60 0.70 0.80 0.90 1.00 Net Traction Ratio, NTR
TRACTION LOSSES Travel Reduction Plot 1.00 Pull Ratio = NTR/GTR 0.90 Gross Traction Ratio 0.80 Net Traction Ratio Tractive Efficiency 0.70 Velocity Ratio = Va/Vt 0.60 0.50 Traction Performance Ratio 0.40 0.30 0.20 Motion Resistance Ratio = GTR - NTR 0.10 0.00 0 10 20 30 40 50 Travel Reduction, %
TRACTION DATA PLOT With Experimental Data Tire = 20.8R42 Dual Surface = Lon's Tilled (seeded) 6/6/96 1.00 0.90 Tractive Efficiency 0.80 0.70 0.60 0.50 Traction Performance Ratio Net Traction Ratio 0.40 0.30 Motion Resistance Ratio 0.20 0.10 0.00 -0.05 0.00 0.05 0.10 0.15 0.20 0.25 0.30 0.35 0.40 Travel Reduction Ratio
TRADITIONAL SLIP PLOT With Experimental Data and Regression Curves Surface = Lon's Tilled (seeded) 6/6/96 Tire = 20.8R42 Dual 1.00 0.90 Tractive Efficiency 0.80 0.70 0.60 Net Traction Ratio 0.50 Traction Performance Ratio NTR = 0.664(1-exp-0.098(TRR)) 0.40 MRR = 0.090 + 0.001(TRR)) 0.30 Motion Resistance Ratio 0.20 0.10 0.00 -0.05 0.00 0.05 0.10 0.15 0.20 0.25 0.30 0.35 0.40 Travel Reduction Ratio
0.00 0.10 0.20 0.30 0.40 0.50 0.60 0.70 0.80 0.90 1.00 NET TRACTION RATIO PLOTWith Experimental Data Tire = Goodyear 20.8R42 DT/DT710 Dual Surface = Lon's Tilled (seeded) 6/6/96 1.00 0.90 Tractive Efficiency 0.80 0.70 0.60 Traction Performance Ratio 0.50 0.40 0.30 Travel Reduction Ratio 0.20 0.10 Motion Resistance Ratio 0.00 Net Traction Ratio, NTR
1.00 0.90 Tractive Efficiency 0.80 0.70 0.60 Traction Performance Ratio 0.50 NTR = 0.664(1-exp-0.098(TRR)) 0.40 MR = 0.090 + 0.001(TRR)) 0.30 Travel Reduction Ratio 0.20 0.10 Motion Resistance Ratio 0.00 NET TRACTION RATIO PLOTInput Data with Regression Tire = Goodyear 20.8R42 DT/DT710 Dual Surface = Lon's Tilled (seeded) 6/6/96 0.00 0.10 0.20 0.30 0.40 0.50 0.60 0.70 0.80 0.90 1.00 Net Traction Ratio, NTR
Simplest Form of Single Wheel Tester Va With a single arm, torque T results in a change in vertical reaction which must then be measured during the test. w W T NT rr slr rt MR GT Wd
Parallel Arm Single Wheel Tester With parallel arms there is no change in vertical reactionas torque is applied. Va w W NT/2 T NT/2 rt rr slr Net Traction can be calculated as the sum of the reaction forces. Torque can be calculated by the difference in the forces multiplied by the distance between the arms. MR GT Wd
Parallel Arm Single Wheel Tester With Direct Measurement of NT With parallel arms there is no change in vertical reactionas torque is applied, ie, W = Wd. Va w W T rr slr rt NT MR GT Wd
2WD Tire Test Tractor w Va RWS FWS* P c T rt rr slr Dh MR MRf GT FWD RWD Wb *Front Static Weight is usually set to be approx 20% of total tractor weight.
Tire Test Tractor Load Tractor Va Vt RWS FWS c c Dh Dh RWD FWD Wb
SPEED EFFECTS ON MOTION RESISTANCE Tire =710/70R38 "Loose" Soil 1.00 40.0 0.90 35.0 0.80 Axle Power, kW 30.0 Axle Power, kW 0.70 25.0 0.60 0.50 20.0 Motion Resistance Ratio 4.5 m/s = 10 mph 0.40 15.0 0.30 10.0 0.20 MRR = 0.0079(Vt) + 0.0806 5.0 0.10 0.00 0.0 0.0 1.0 2.0 3.0 4.0 5.0 6.0 Theoretical (no slip) Travel Speed, Vt, m/s
Efficient Pull Range 1.0 Peak TE 0.9 0.8 0.7 0.6 Tractive Efficiency Ratio Max Pull (slip limited) 0.5 0.4 Pull @ Max TE 0.3 0.2 0.1 Travel Reduction Ratio 0.0 0.00 0.10 0.20 0.30 0.40 0.50 0.60 0.70 0.80 0.90 1.00 Net Traction Ratio, NTR How to Interpret Traction Plots Performance of 20.8R42 Duals on Three Surfaces Traction Performance Ratios
Performance of 20.8R42 Duals on Three Surfaces San Marcos, Texas 8300 kg Axle Load 83 kPa Tire Pressure 1.00 Tractive Efficiency 0.90 0.80 0.70 0.60 Traction Performance Ratios 0.50 Tilled Untilled Subsoiled 0.40 0.30 0.20 Travel Reduction Ratio 0.10 0.00 0.00 0.10 0.20 0.30 0.40 0.50 0.60 0.70 0.80 0.90 1.00 NET TRACTION RATIO, NTR
Performance of Single 710/70R38 Firestone ATR at Two Air Pressures Tilled (Loose) Tractive Conditions 1.00 0.90 0.80 Tractive Efficiency 0.70 0.60 0.50 6 psi load @ 6 psi (correct) (41kPa) (41kPa) Traction Performance Ratios 6 psi load @ 28 psi (41kPa) (193kPa) 0.40 0.30 Travel Reduction Ratio 0.20 0.10 0.00 0.00 0.10 0.20 0.30 0.40 0.50 0.60 0.70 0.80 0.90 1.00 NET TRACTION RATIO, NTR
Performance of Two Sizes of Single Tires at Correct Pressures Tilled (Loose) Tractive Conditions 1.00 0.90 Tractive Efficiency 0.80 0.70 0.60 0.50 Traction Performance Ratios 710/70R38, 6 psi load @ 6 psi (correct) (41kPa) (41kPa) 520/85R46, 8 psi load @ 8 psi (correct) (55kPa) (55kPa) 0.40 0.30 Travel Reduction Ratio 0.20 0.10 0.00 1.00 0.00 0.10 0.20 0.30 0.40 0.50 0.60 0.70 0.80 0.90 NET TRACTION RATIO, NTR
Performance of Single Tire at Two Weights with Correct Pressures GY 520/85R46 DTR Tilled (Loose) Tractive Conditions 1.00 0.90 Tractive Efficiency 0.80 0.70 8 psi load @ 8 psi (correct) (55kPa) (55kPa) 0.60 16 psi load @ 16 psi (correct) (110kPa) (110kPa) Traction Performance Ratios 0.50 0.40 0.30 0.20 Travel Reduction Ratio 0.10 0.00 0.00 0.10 0.20 0.30 0.40 0.50 0.60 0.70 0.80 0.90 1.00 NET TRACTION RATIO, NTR
BELT WIDTH COMPARISON San Marcos, Firm Untilled Tractive Condition Belted Tractor Total Weight = 12700 kg Wheel Tractor Axle Weight = 8303 kg 1.00 Tractive Efficiency 0.90 Cat 32”(810mm) 0.80 0.70 20.8R42 Dual Tires 0.60 Cat 16”(400mm) 0.50 Cat 25”(630mm) Traction Performance Ratios 0.40 0.30 Travel Reduction Ratio 0.20 0.10 0.00 0.00 0.10 0.20 0.30 0.40 0.50 0.60 0.70 0.80 0.90 1.00 NET TRACTION RATIO, NTR
BELT WIDTH COMPARISON San Marcos, Tilled Tractive Condition Belted Tractor Total Weight = 12700 kg Wheel Tractor Axle Weight = 8303 kg 1.00 Tractive Efficiency 0.90 0.80 Cat 32”(810mm) Cat 16”(400mm) 0.70 0.60 20.8R42 Duals 0.50 Traction Performance Ratios Cat 25”(630mm) 0.40 0.30 0.20 0.10 Travel Reduction Ratio 0.00 0.00 0.10 0.20 0.30 0.40 0.50 0.60 0.70 0.80 0.90 1.00 NET TRACTION RATIO, NTR
BELT WIDTH COMPARISON San Marcos, Subsoiled Soil Condition Belted Tractor Total Weight = 12700 kg Wheel Tractor Axle Weight = 8303 kg 1.00 Tractive Efficiency 0.90 Cat 32”(810mm) 0.80 0.70 Cat 16”(400mm) 0.60 0.50 Cat 25”(630mm) Traction Performance Ratios 20.8R42 Duals 0.40 0.30 0.20 0.10 Travel Reduction Ratio 0.00 0.00 0.10 0.20 0.30 0.40 0.50 0.60 0.70 0.80 0.90 1.00 NET TRACTION RATIO, NTR
BELT MFG COMPARISON San Marcos, Firm Untilled Belted Tractor Total Weight = 12700 kg Wheel Tractor Axle Weight = 8303 kg 1.00 Tractive Efficiency 0.90 Cat 16”(400mm) 0.80 0.70 0.60 20.8R42 Duals 0.50 GY 16”(400mm) Traction Performance Ratios 0.40 0.30 0.20 0.10 Travel Reduction Ratio 0.00 0.00 0.10 0.20 0.30 0.40 0.50 0.60 0.70 0.80 0.90 1.00 NET TRACTION RATIO, NTR
BELT MFG COMPARISON San Marcos, Tilled Belted Tractor Total Weight = 12700 kg Wheel Tractor Axle Weight = 8303 kg 1.00 Tractive Efficiency 0.90 0.80 0.70 Cat 16”(400mm) 0.60 20.8R42 Duals 0.50 GY 16”(400mm) Traction Performance Ratios 0.40 0.30 0.20 0.10 Travel Reduction Ratio 0.00 0.00 0.10 0.20 0.30 0.40 0.50 0.60 0.70 0.80 0.90 1.00 NET TRACTION RATIO, NTR
BELT MFG COMPARISON San Marcos, Subsoiled Belted Tractor Total Weight = 12700 kg Wheel Tractor Axle Weight = 8303 kg 1.00 0.90 Tractive Efficiency 0.80 0.70 0.60 Cat 16”(400mm) 0.50 Traction Performance Ratios 20.8R42 Duals GY 16”(400mm) 0.40 0.30 0.20 0.10 Travel Reduction Ratio 0.00 1.00 0.00 0.10 0.20 0.30 0.40 0.50 0.60 0.70 0.80 0.90 NET TRACTION RATIO, NTR
Cat 25“ (630mm) Belt on Three Surfaces San Marcos, Texas Belted Tractor Total Weight = 12700 kg Wheel Tractor Axle Weight = 8303 kg 1.00 Tractive Efficiency 0.90 0.80 0.70 Subsoiled Subsoiled 0.60 Untilled 0.50 Traction Performance Ratios Tilled 0.40 0.30 0.20 Travel Reduction Ratio 0.10 0.00 0.00 0.10 0.20 0.30 0.40 0.50 0.60 0.70 0.80 0.90 1.00 NET TRACTION RATIO, NTR
Performance of 20.8R42 Duals on Three Surfaces San Marcos, Texas 8300 kg Axle Load 83 kPa Tire Pressure 1.00 Tractive Efficiency 0.90 0.80 0.70 0.60 Traction Performance Ratios 0.50 Tilled Untilled Subsoiled 0.40 0.30 0.20 Travel Reduction Ratio 0.10 0.00 0.00 0.10 0.20 0.30 0.40 0.50 0.60 0.70 0.80 0.90 1.00 NET TRACTION RATIO, NTR
Belted and Tire Vehicle Power Delivery Performance Primary Tillage Using PTO Power calculated from engine power 1.0 PTO POWER DELIVERY EFFICIENCY 0.9 TIRE VEHICLE 0.8 0.7 0.6 BELTED VEHICLE 0.5 Tractor Performance Ratios 0.4 0.3 TIRE VEHICLE 0.2 TRAVEL REDUCTION RATIO 0.1 BELTED VEHICLE 0 0.0 0.1 0.2 0.3 0.4 0.5 0.6 0.7 0.8 0.9 Vehicle Traction Ratio, VTR
Belted and Tired Vehicle Tractive Performance Primary Tillage 1 TRACTIVE EFFICIENCY BELT 0.9 0.8 TIRE 0.7 0.6 0.5 Traction Performance Ratios 0.4 0.3 TIRE TRAVEL REDUCTION RATIO 0.2 0.1 BELT 0 0 0.1 0.2 0.3 0.4 0.5 0.6 0.7 0.8 0.9 Vehicle Traction Ratio, VTR
APPROXIMATE AGRICULTURAL TRACTOR POWER RELATIONSHIPS Drivetrain • Constant Power Units & Test Conditions GROSS FLYWHEEL .91 .92 .77-.80 .82-.84 NET FLYWHEEL .84-.88 .89-.91 .99 TRANSMISSION INPUT .90-.92 .85-.90 0.96 AXLE PTO
Tractor Performance Prediction Spreadsheet Outputs Db Power Wheel Slip Power split Tire pressures Va Inputs: Traction EquationsTire size, type, noRadial, Bias, SinglesDuals, Triples Vt RWS FWS Pull ang+ HT+ c Dh P or U RWD DIS+ DIS+ FWD Resultant Implement force Wb Axle Power Soil Strength, Cone Index
Approximate Agricultural Tractor Power Relationships Drawbar 0.96 PTO AXLE CONC GOOD MED POOR TRACTOR CONC GOOD MED POOR PTO Power Delivery Efficiency Axle Power Delivery Efficiency TYPE .91 .75 .70 .57 2WD .87 .72 .67 .55 .91 .79 .75 .66 MFWD .87 .76 .72 .64 .92 .80 .78 .73 4WD .88 .77 .75 .70 .92 .85 .83 .81 BELT .88 .76 .74 .72 DRAWBAR
OPTIMUM GROSS TRACTION RATIO Brixius Equation Revised For Radials 1.0 MAX TE GTR = 0.54 Travel Reduction, % >> 4 Concrete 6 8 0.9 10 BN 0.8 40 20 25 Tractive EfficiencyRatio 0.7 15 30 0.6 40 10 0.5 0.4 0.80 0.30 0.50 0.70 0.40 0.60 Gross Traction Ratio, GTR
WT-SPEED-POWER RELATIONSHIP 150 0.40 Gross Traction Ratio 0.45 140 0.50 130 0.55 120 Optimum Gross Traction Ratio 0.60 110 Tractor Weight, kg/axle kW 100 90 80 70 60 50 5 7 9 11 13 15 No-Slip Travel Speed, km/h