Download

1 / 54
540 likes | 694 Views
Packaged Application Tuning. David Kurtz Go-Faster Consultancy Ltd. david.kurtz@go-faster.co.uk www.go-faster.co.uk. Packaged Application Tuning. Who am I? What is Tuning? What is a Packaged Application? What techniques could you use? Experimental Session

E N D
Packaged Application Tuning David Kurtz Go-Faster Consultancy Ltd. david.kurtz@go-faster.co.uk www.go-faster.co.uk
Packaged Application Tuning • Who am I? • What is Tuning? • What is a Packaged Application? • What techniques could you use? • Experimental Session • Are you, the membership, interested in discussing Application specific issues?
Rules of Engagement • If you can’t hear me - say so now! • Feel free to ask on-topic questions during the presentation. • This presentation (with notes) is available on the conference website (after the conference) and on • www.go-faster.co.uk
Who am I? • DBA • Independent consultant • Performance tuning • PeopleSoft • UKOUG Unix SIG Chair
Aphorism • Performance is exactly what the user perceives it to be. No more, no less. • Poor performance is when the user’s perception does not match their expectation.
Aphorism • Performance Tuning is a search for lost time.
When you have eliminated the impossible, whatever remains, however improbable, must be the truth. A Study in Scarlet, Arthur Conan-Doyle Aphorism • It is a capital mistake to theorise before one has data. The Memoirs of Sherlock Holmes, Arthur Conan-Doyle
Aphorism • Detection is, or ought to be, an exact science. It should be be treated in the same cold and unemotional manner. • The Sign of Four, Arthur Conan-Doyle
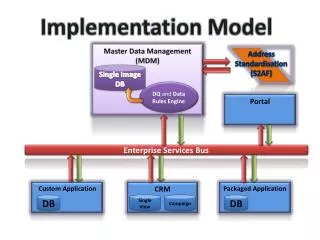
What is a Packaged Application • Bought in from a software vendor. • You didn’t have any say in how it was developed. • You cannot (easily) change the code. • You may not even be able to see the code. • It may be designed to run on other databases as well as Oracle.
What Packaged Applications are there? • ERP • Oracle, SAP, PeopleSoft • Baan, J D Edwards ... • CRM • and Siebel • What others?
It isn’t always the database! • Understand architecture • Web front end • Network • Application server • Database • What can you measure?
Java Servlet (presentation logic) Tuxedo Application Server (application logic) DBMS (application data & meta-data http / https Tuxedo Message SQL PeopleSoft Internet Architecture • PIA is 4-tier architecture • Each component can contribute to response time • Need to measure each component
Sources of Metrics • Browser • Proxy Server • 3rd Party software • Local agent on PC • Web Server • Access Log
Sources of Metrics (2) • BEA/Tuxedo • Service Trace • TMADMIN • Oracle Database • SQL_Trace • PSFT Application Server Trace
Java Servlet (presentation logic) Tuxedo Application Server (application logic) DBMS (application data & meta-data http / https Tuxedo Message SQL Sources of Metrics Proxy Server Access Log Tuxedo tmadmin script Tuxedo Service Trace Oracle SQL*Trace Webserver Access Log
Standard format for access log www.w3.org/pub/WWW/TR/logfile.html Apache is different Web/Proxy Access Log
Web/Proxy Access Log • Fields • Date, Time • Time Taken • accurate to OS time units (1/100ths or 1/1000ths) • only 1s on Apache • Message bytes • IP addresses & DNS names • URI stem & Query
Apache Access Log #httpd.conf LogFormat "%{%Y.%m.%d %H:%M:%S}t|%T|%B|%u|%h|%{User-Agent}i|%>s|%m|%U|%q" monitoring CustomLog logs/access.log monitoring
Sample Apache Access Log 2002.02.26 09:57:06|0|275|-|127.0.0.1|Mozilla/4.0 (compatible; MSIE 6.0; Windows NT 4.0; Q312461)|200|GET|/peoplesoft8/cache/PT_NEXTTAB_ENG_1.gif| 2002.02.26 09:57:17|0|31847|-|127.0.0.1|Mozilla/4.0 (compatible; MSIE 6.0; Windows NT 4.0; Q312461)|200|POST|/servlets/iclientservlet|?ICType=Panel&Menu=ADMINISTER_WORKFORCE_(GBL)&Market=GBL&PanelGroupName=JOB_DATA 2002.02.26 09:57:26|0|30959|-|127.0.0.1|Mozilla/4.0 (compatible; MSIE 6.0; Windows NT 4.0; Q312461)|200|POST|/servlets/iclientservlet|?ICType=Panel&Menu=ADMINISTER_WORKFORCE_(GBL)&Market=GBL&PanelGroupName=JOB_DATA
What does the access log tell us? • A date and time for every request • Who made the request? • How long did it take to serve? • What was requested? • Which component (panel group)?
BEA/Tuxedo Service Trace • Edit psappsrv.ubx file • CLOPT=“-r -e APPQ.stderr…” • -r enables trace to stderr file • -e qualifies name of stderr file
Sample Tuxedo Service Trace • Each service called to domain is logged SERVICE PID SDATE STIME EDATE ETIME ------- --- ----- ----- ----- ----- @ICScript 390 1014717320 4586495 1014717322 4588397 @ICScript 390 1014717322 4588467 1014717322 4588537 @ICScript 390 1014717322 4588557 1014717323 4589259 @ICScript 390 1014717332 4598021 1014717332 4598171 @ICScript 390 1014717355 4621745 1014717361 4627554 @ICScript 390 1014717365 4631329 1014717366 4632511 @ICScript 390 1014717375 4641944 1014717377 4643306 @ICPanel 390 1014717380 4646761 1014717381 4647783 @ICPanel 390 1014717388 4654202 1014717391 4657567 @ICPanel 390 1014717396 4662614 1014717401 4667271
Tuxedo Service Trace • Service - Name of Service • Pid - An OS PID of listener or handler • Sdate/Edate - Start/End Date • Seconds since 00:00hrs GMT 1st January 1970. • Stime/Etime • Start/End Time in OS time units (1/ 100ths or 1/1000ths) • Hence calculate accurate service duration • Time on Server - not queuing
BEA/Tuxedo TMADMIN Utility • BEA Interactive command line interface • Can be included in scripts • -r for read only in monitoring scripts • pq (printqueue) • psr (printserver) • pclt (printclient)
PQ • What queues in domain • How many servers on queue • How many requests queued • (How much work on queue) Prog Name Queue Name # Serve Wk Queued # Queued Ave. Len Machine --------- ------------------- --------- -------- -------- ------- JSL.exe 00095.00200 1 - 0 - GO-FASTER+ JREPSVR.exe 00094.00250 1 - 0 - GO-FASTER+ PSSAMSRV.exe SAMQ 1 - 0 - GO-FASTER+ BBL.exe 54455 1 - 0 - GO-FASTER+ WSL.exe 00001.00020 1 - 0 - GO-FASTER+ PSAPPSRV.exe APPQ 1 - 0 - GO-FASTER+
PSR • What servers exist? • How many requests have they handled? • What are they doing right now? Prog Name Queue Name Grp Name ID RqDone Load Done Current Service --------- ---------- -------- -- ------ --------- --------------- BBL.exe 54455 GO-FAST+ 0 3 150 ( IDLE ) PSAPPSRV.exe APPQ APPSRV 1 9 450 ICPanel PSSAMSRV.exe SAMQ APPSRV 100 0 0 ( IDLE ) WSL.exe 00001.00020 BASE 20 0 0 ( IDLE ) JSL.exe 00095.00200 JSLGRP 200 0 0 ( IDLE ) JREPSVR.exe 00094.00250 JREPGRP 250 5 250 ( IDLE )
PCLT • Who is connected? • Are they doing something? • When did they connect? LMID User Name Client Name Time Status Bgn/Cmmt/Abrt --------------- --------------- --------------- -------- ------- ------------- GO-FASTER-1 NT WSH 0:21:14 IDLE 0/0/0 GO-FASTER-1 NT JSH 0:21:13 IDLE 0/0/0 GO-FASTER-1 NT tmadmin 0:00:00 IDLE 0/0/0 GO-FASTER-1 PS JavaClient 0:02:30 BUSY/W 0/0/0
Oracle SQL Trace • Tuning tool • Session trace • Format it with TKPROF • Find long running SQL statements • Total SQL Time for session call count cpu elapsed disk query current rows ------- ------ -------- ---------- ---------- ---------- ---------- ---------- Parse 72289 173.06 175.45 7 14654 94 0 Execute 77140 64.02 67.37 205495 766343 170611 78630 Fetch 50599 33.20 34.28 17302 971624 80146 143218 ------- ------ -------- ---------- ---------- ---------- ---------- ---------- total 200028 270.28 277.10 222804 1752621 250851 221848
Small Application Servers • Create small application with just a single handler process • Enable trace on that process • Trace sample transaction (only one user) sys.dbms_system.set_sql_trace_in_session(<sid>,<serial>,TRUE);
Java Servlet (presentation logic) Tuxedo Application Server (application logic) DBMS (application data & meta-data http / https Tuxedo Message SQL Sources of Metrics Proxy Server Access Log Tuxedo tmadmin script Tuxedo Service Trace Oracle SQL*Trace Webserver Access Log
Graphical Analysis • Don’t drown in numbers • Draw a picture • Load Data into Database • SQL_Loader (Oracle 9i External Table) • Process Data • Matching, Aggregation • Oracle Analytic Function • Load data into Excel • Draw Graph
Sample SQL*Loader File LOAD DATA INFILE 'APPQ.stderr' REPLACE INTO TABLE txrpt WHEN (1) = '@' FIELDS TERMINATED BY WHITESPACE TRAILING NULLCOLS (service "substr(:service,2)" -- remove leading @ ,pid ,stimestamp ":stimestamp/86400+2/24+TO_DATE('01011970','DDMMYYYY')" ,stime ":stime/100" ,queue ”’APPQ’" ,etime ":etime/100")
Tips about Graphs • Connect Excel directly to a database • Aggregate data carefully • Too little and excel draws it badly because it adds a black border around an area • Too much and you lose details • Pivot tables are useful • but Excel97 buggy • Scatters and Trendlines • joining dots can obscure data • Excel supports 32000 points per series
Batch Performance • Sources of Metrics • Graph
Sources of Metrics • Process Scheduler Request Table • every scheduled process recorded on this table • start and end time • Application Traces • SQL Trace
Oracle SQL*Trace & TKPROF • Enable SQL Trace on batch process • Process trace file with TKPROF • report Top n statements • sort by • Parse/Fetch/Execute • CPU/Elapsed Time • statement timings/execution plan call count cpu elapsed disk query current rows ------- ------ -------- ---------- ---------- ---------- ---------- ---------- Parse 36 0.02 0.01 0 0 0 0 Execute 36 55.09 86.80 0 2973787 3 1 Fetch 0 0.00 0.00 0 0 0 0 ------- ------ -------- ---------- ---------- ---------- ---------- ---------- total 72 55.11 86.81 0 2973787 3 1
Process Scheduler Status Change On-Connect Enable Trace Archiving data during purge routines Altering session parameters Triggers
Process Scheduler CREATE OR REPLACE trigger sysadm.set_trace before update of runstatus on sysadm.psprcsrqst for each row when (new.runstatus = 7 and old.runstatus != 7 and new.prcstype IN('Application Engine','COBOL SQL', 'SQR Process','SQR Report','SQR Report For WF Delivery'))
On-Connect Triggers create or replace trigger sysadm.psqrysrv_session_trigger after logon on sysadm.schema declare l_program VARCHAR(64); begin SELECT program INTO l_program FROM v$session WHERE sid IN(SELECT sid FROM v$mystat WHERE rownum = 1); IF substr(l_program,1,8) = 'PSQRYSRV' OR INSTR(UPPER(l_program),'PSNVS') > 0 THEN sys.dbms_session.set_sql_trace(true); ...
For example… sys.dbms_session.set_sql_trace(true); ALTER SESSION SET EVENTS '10053 trace name context forever, level 1’; ALTER SESSION SET EVENTS '10128 trace name context forever, level 2’; ALTER SESSION SET optimizer_mode=FIRST_ROWS; ALTER SESSION SET optimizer_index_caching=100; ALTER SESSION SET optimizer_index_cost_adj=1; ALTER SESSION SET sort_area_size = 100000; sys.dbms_application_info.set_module('nVision','psqrysrv_session_trigger fired');