Download
1 / 19
190 likes | 369 Views
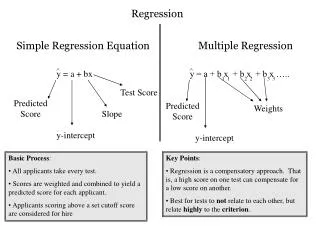
Regression . Simple Regression Equation Multiple Regression. . . y = a + bx. y = a + b x + b x + b x …. 1 1 2 2 3 3. Test Score. Predicted Score. Predicted Score. Weights. Slope. y-intercept. y-intercept. Basic Process :

E N D
Regression Simple Regression Equation Multiple Regression y = a + bx y = a + b x + b x + b x ….. 1 1 2 2 3 3 Test Score Predicted Score Predicted Score Weights Slope y-intercept y-intercept • Basic Process: • All applicants take every test. • Scores are weighted and combined to yield a predicted score for each applicant. • Applicants scoring above a set cutoff score are considered for hire • Key Points: • Regression is a compensatory approach. That is, a high score on one test can compensate for a low score on another. • Best for tests to not relate to each other, but relate highly to the criterion.
y Y = 1 + .5X X=12, what is y? If satisfactory performance is a score of 5, what would the score on X need to be? 10 9 8 7 6 5 4 3 2 1 Job Performance * * * * * * * * * * * * * * * * * * * * * * * * * * * * * * * * * * * * * * * * * * * * * * * * * * * * * * * * * * * * * * * x 1 2 3 4 5 6 7 8 9 10 11 12 Test Scores
Compensatory Example How Four Job Applicants with Different Predictor Scores Can Have the Same Predicted Criterion Score Using Multiple Regression Analysis Predicted Criterion Score Applicant Score on X Score on X 1 2 A 25 0 100 B 0 50 100 C 20 10 100 D 15 20 100 Note: Based on the equation Y = 4X + 2X. 1 2
Independent Predictors r r 1c 2c Predictor 1 Criterion Predictor 2 • 2 2 • 2 2 2 R = r + r For example, if r = .60 and r = .50, then R = (.60) + (.50) = .36 + .25 = .61 c.12 1c 2c 1c 2c c.12
Interrelated Predictors Criterion r r 1c 2c r 12 Predictor 1 Predictor 2 2 2 r r - 2r r r 1c 2c 12 1c 2c 2 R = c.12 1 - r 2 12 For example, if the two predictors intercorrelate .30, given the validity coefficients from the previous example And r = .30, we will have 12 2 2 (.60) + (.50) - 2(.30)(.60)(.50) 2 R = = .47 c.12 1 – (.30) 2
Multiple Cutoff Approach Paper & Pencil Math Test 100 Paper & Pencil Aptitude Test 100 WAB 100 X X Pass Pass Pass Cutoff score Cutoff score Cutoff score X Fail Fail Fail 0 0 0 • Basic Process: • All applicants take every test. • Applicant must achieve a passing score on every test to be considered for hire. • Key Point: A multiple cut-off approach can lead to different decisions regarding who to hire versus using a regression approach.
Multiple Hurdle Approach Work Sample Test 100 Paper & Pencil Knowledge Test 100 Interview 100 xxx xx xxxxxx xxx xxx Cutoff score Pass Pass Pass Cutoff score Cutoff score x xxxx xx xx Fail Fail Fail Eliminated from the selection process Eliminated from the selection process 0 Eliminated from the selection process 0 0 • Basic Process: • All applicants take the 1st test. • Pass/fail decisions are made on the 1st and subsequent tests and only those who pass can continue on to the next test [a sequential process]. • Key Point: • Useful when a lengthy, costly, and complex training process is required for the position.
Banding “The basic premise behind banding is consistent with psychometric theory. Small differences in test scores might reasonably be due to measurement error, and a case can be made on the basis of classical measurement theory for a selection system that ignores such small differences, or at least does not allow small differences in test scores to trump all other consideration in ranking individuals in hiring.” (p. 82). “There is legitimate scientific justification for the position that small differences in test scores might not imply meaningful differences in either the construct measured by the test or in future job performance.” (p. 85). From the Scientific Affairs Committee of the Society for Industrial-Organizational Psychology (Report, 1994)
Banding Types Traditional SED (standard error of the difference) Using tests of statistical significance to determine test bands considered equal Consideration of the SEM of the test (standard deviation, test reliability, and level of confidence desired) (e.g., bands determined based on trend analysis, expert opinion) 100 - 90 89 - 80 79 - 70
Banding (cont.) SED Banding Types Both use the top score to establish the top of the band Fixed Sliding .. . .. 96 . . .. .. 96 All those from the band are selected before those from the lower band Bands slide down after each person is removed from the top (bands re-established) 94 92 92 90 90 .. . .. .. . .. 88 88 84 86 82 82 SEM = 6.0 SEM = 6.0
Banding (cont.) Purposes of Banding --- Fairness (e.g., test scores not significantly different are best treated as equivalent) Some loss of predictive power (as compared to top-down selection) Increase diversity Greater diversity is obtained with the use of sliding bands and points for minority status
Predicted Criterion Scores (in Z-score units) for Three Applicants To Each of Three Job and Assignments Made under Three Alternative Classification Strategies Number of jobs adequately held Number of workers placed according to their highest talent Job 1 Job 2 Job 3 Worker A Worker B Worker C Minimum Qualification score (in Z-score units) Classification Strategies: Place each according to his best talent (vocational guidance) Fill each job with the most qualified person (pure selection) Place workers so that all jobs are filled by those with adequate talent (cut and fit) 1.0 0.8 1.5 0.7 0.5 -0.2 -0.4 -0.3 -1.6 0.9 0.0 -2.0 B C A 1 1 A A A 1 1 A B C 3 0 Source: From Applied Psychology in Personnel Management (2nd ed) by Wayne Casco. 1982.


