Download
1 / 11
110 likes | 310 Views
Programming and Debugging with the Dragon and JTAG. Many thanks to Dr. James Hawthorne for evaluating the Dragon system and providing the core content for these slides. What this course involves.

E N D
Programming and Debugging with the Dragon and JTAG Many thanks to Dr. James Hawthorne for evaluating the Dragon system and providing the core content for these slides.
What this course involves • The course is fundamentally about the development of smart systems – we focus on embedded systems and will use Atmel microcontrollers as the core of our systems. • You will be writing code to run on the ATmega1281 microcontroller which is housed on the STK300 development board. • Your code will largely be reading and writing to and from physical hardware devices such as LED’s, switches, motors, servos, and various sensors, etc. • Your coursework will involve controlling these devices – i.e. through programming in C or assembly. • The course lab work is vital for developing the required skills and experience in developing embedded systems (e.g. The coursework) • The program development will be done using Atmel Studio 6. • In addition we have the Dragon JTAG devices which simplify loading the programs into the Atmel chips and support run-time debugging.
Why dynamic debugging • Embedded systems require the development environment (Atmel Studio on the PC) is different from the run-time environment (the microcontroller). Thus, whilst the compiler finds syntax errors, it is much harder to find logical / semantic errors while the code is in the development environment – i.e. We can’t run it to see what happens! • Debugging provides information such as ‘Does the program reach a certain line of code?’. ‘Is the program doing what I expect at the line of code?’ ‘What happens to a certain variable at a particular line of code?’ • You need to find out where the error is in a program even if you just output some ‘debug’ text to the screen at critical points in your code → easy to do when developing desktop applications in Java (e.g.) but not so easy for an embedded application. • The only output you have by default on STK300 boards are the LED’s – you can display patterns to signal the state of the program – but this is limited. • The Dragon device fills this gap – it allows us to run the program on the deployment platform, whilst viewing the output and status on the PC screen. • Ultimately, efficient debugging tools and techniques save you a lot of time.
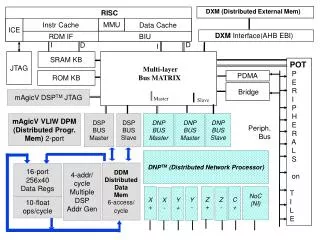
STK300 and AVR Dragon hardware setup • Plug the STK300 power supply lead into the board and plug the power unit into the wall. • Plug the IDC ribbon cable into the JTAG ports on the STK300 board and on the AVR Dragon board (Be very careful to make sure the connectors are in the right place and the right way round – see the pictures, and pay attention to the red strip which marks bit 0). • Plug the USB cable into a spare port on the computer and the other end into the Dragon. • The Dragon can be interfaced directly from AVR studio to both program and debug the chip.
STK300 Board ATmega1281 microcontroller DRAGON Programmer/Debug board IDC10 cable connects Dragon Board STK300. Take great care with the orientation of this cable, note the position of the red wire and connector at each end Power cable for STK300 Board USB cable connects Dragon Board to PC and also provides power
Verify that the AVR Dragon and the STK board are connected correctly and that the Dragon is interfaced to Atmel Studio 6 1. In Atmel Studio 6 go to Tools→Device Programming.2. Select Tool: AVR Dragon tool, Device: ATmega1281, Interface: JTAG, and click Apply.3. Target voltage should read approximately 5.0V.4. Read the unique Device Signature. If Atmel studio can read the device signature (displayed as a hexadecimal number) then the interface between PC and Atmel, via the Dragon, is correct.
Building your code (creating a .hex file) • To program the Atmel microcontroller, you first need to create a .hex file. This is essentially the machine language version of your C or assembly program. • In Atmel studio 6, Click Build -> Build solution • If there are no errors it should report: Build succeeded. ========== Rebuild All: 1 succeeded, 0 failed, 0 skipped ========== • A .hex file will be created within your project folder. • Note, if using C, the .hex file will be placed in either a ‘debug’ or ‘release’ sub-folder.
Programming through AVR Studio 6 By ‘programming’ we mean uploading our code (the .hex file) to the Atmel microcontroller via a device called the programmer (the Dragon in this case). 1. Select 'Memories' tab in Tools→Device programming 2. Select a hex file to program (browse to the file) 3. Make sure Erase Device and Verify flash are checked 4.Click 'Program’.
Debugging through AVR Studio 6 This C program can be used to demonstrate debugging with the Dragon. The while loop doubles the ‘ledValue’ value and displays its 1s compliment on the LED’s connected to Port B. Delay() adds about 1 second delay to the loop so you can see the LED’s moving. The call to Delay() has been commented out to simplify single-step debugging. You can enter debug mode by pressing the green triangle ‘play’ button at the top of Atmel studio (or F5). To end your debug session, click the ‘stop’ button (or Cntl + Shift + F5). See also the sample code that has been provided with dynamic debug instructions added: Dragon_Debug_BinaryCount_1281_asm Dragon_Debug_BinaryCount_1281_C
Breakpoints • Place a breakpoint by clicking in the margin next to the if statement (the line will become highlighted red). • Run the debugger again and the program will pause when it hits this line. • Several important things should be noticed: - Hover the mouse pointer over the ledValue variable and it will show you the real value. It should be 2. - Click continue or press F5. ledValue should be 4 this time round, next 8, 16 etc. - Also notice that the LED’s change every time you press F5. • You can directly change the value of ports and registers by opening the interface and clicking to toggle the individual bits. • One of the biggest advantages of debugging with the dragon is that you can physically see the state of the hardware in relation to the state of the software.
Stepping through code and editing code “on the fly” • Once the program is paused (at a breakpoint), you can even step through the code one line at a time or edit a line of code while the program is running. • For stepping through code use step into (F11), step over (F10) and step out (Shift+F11) which steps into a method which we are paused on, steps over and steps out respectively. • Change a line of code before it gets executed then run it to see the result all while the program is still running. • Ultimately, effective debugging will save you a lot of time, so learn how to use it ASAP.