Download
1 / 27
270 likes | 355 Views
Ecology: Ch 42 – 43 . AP Biology 2013. Basic Terms to Remember. Abiotic vs. Biotic Ecology Who came up with the term ecology? Haeckel Hierarchy of Ecological Systems. Biome. Biome —a distinct physical environment inhabited by ecologically similar organisms with similar adaptations.

E N D
Ecology: Ch 42 – 43 AP Biology 2013
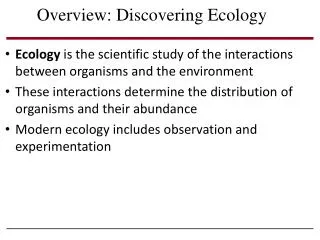
Basic Terms to Remember • Abiotic vs. Biotic • Ecology • Who came up with the term ecology? • Haeckel • Hierarchy of Ecological Systems
Biome • Biome—a distinct physical environment inhabited by ecologically similar organisms with similar adaptations. • Can be terrestrial or aquatic • Terrestrial biomes are characterized by their vegetation, and soil characteristics • Aquatic biomes are determined by physical factors such as water depth and current, temperature, pressure, salinity, and substrate characteristics.
Ch 43 Populations
Population Density vs. Population Size • Population Density – the number of individuals per unit of area (for terrestrial organisms) or volume (for organisms that live in air, soil or water) • Is dynamic – changes over time • Population Size – the total number of individuals in the population
Births Increase and Deaths Decrease Population Size Change in population size depends on the number of births and deaths over a given time. “Birth–death” or BD model of population change: N = population size B = number of births in the time interval from time t to time t+1 D = number of deaths in same interval
BD Model • Equation is used to calculate population size in the future and most often it changes over time – it will either grow or shrink • The rate of change is called the growth rate of the population • Growth rate can be calculated:
Per capita birth rate (b)—number of offspring an average individual produces Per capita death rate (d)—average individual’s chance of dying Per capita growth rate (r) = (b – d) = average individual’s contribution to total population growth rate
What happens during population changes? • If b > d, then r > 0, and the population grows. • If b < d, then r < 0, and the population shrinks. • If b = d, then r = 0, and population size does not change.
Life History • Life history—time course of growth and development, reproduction, and death during an average individual’s life • Life histories are quantitative descriptions of life cycles. • Example: the life cycle of the black-legged tick.
Life Tables • A life table shows ages at which individuals make life cycle transitions and how many individuals do so successfully. • Life tables have two types of information: • survivorship—fraction of individuals that survive from birth to different life stages or ages • fecundity—average number of offspring each individual produces at those life stages or ages
Life Histories Vary • Life histories vary among species: how many and what types of developmental stages, age of first reproduction, frequency of reproduction, how many offspring they produce, and how long they live. • Life histories can vary within a species. For example, different human populations have different life expectancies and age of sexual maturity.
Resources shape life histories • Individual organisms require resources (materials and energy) and physical conditions they can tolerate. • Rate at which an organism can acquire resources increases with the availability of the resources. • Examples: photosynthetic rate increases with sunlight intensity, or an animal’s rate of food intake increases with the density of food.
Exponential Growth of Populations • Population growth is multiplicative—an ever-larger number of individuals is added in each successive time period. • Charles Darwin was aware of the power of multiplicative growth: • “As more individuals are produced than can possibly survive, there must in every case be a struggle for existence.” • This ecological struggle for existence, fueled by multiplicative growth, drives natural selection and adaptation.
Limitations • Populations do not grow multiplicatively for very long. Growth slows and reaches a more or less steady size:
Per capita growth rate, r • r decreases as the population becomes more crowded; r is density dependent. • As the population grows and becomes more crowded, birth rates tend to decrease and death rates tend to increase. • When r = 0, the population size stops changing—it reaches an equilibrium size called carrying capacity, or K.
Human Populations • The human population is unique. It has grown at an ever-faster per capita rate, as indicated by steadily decreasing doubling times. • Technological advances have raised carrying capacity by increasing food production and improving health.
BIDE Model • The BIDE model of popultion growth adds the number of immigrants (I) and emigrants (E) to the BD growth model.