Download
1 / 24
240 likes | 415 Views
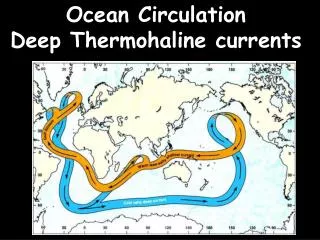
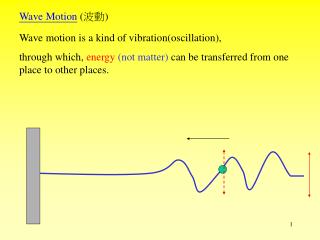
The ocean’s response to the Madden-Julian Oscillation observed by Argo. Karen J. Heywood, Adrian Matthews and Patama Singhruck School of Environmental Sciences University of East Anglia Norwich. The Madden Julian Oscillation (MJO) Madden and Julian (1971, 1972).

E N D
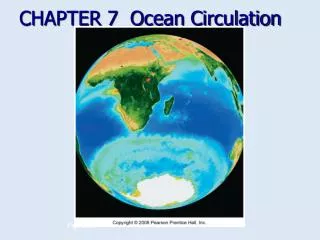
The ocean’s response to the Madden-Julian Oscillation observed by Argo Karen J. Heywood, Adrian Matthews and Patama Singhruck School of Environmental Sciences University of East Anglia Norwich
The Madden Julian Oscillation (MJO)Madden and Julian (1971, 1972) • Dominant mode of intraseasonal variability in the tropical atmosphere • Eastward propagation of large scale convective precipitation anomalies over the Indian Ocean and western Pacific • 30-60 day period • Strong coupling to upper layers of tropical Indian and Pacific • Plays a role in El Nino onset such as in 1997-1998.
The Madden Julian Oscillation (MJO)CMAP precipitation rate: totals and anomalies (mm day-1) http://envam1.env.uea.ac.uk/
Sea surface temperature response to MJOOutgoing longwave radiation (OLR) anomaly as solid (wet) and dotted (dry) contours SST anomaly °C
Why use Argo to look at the MJO? • Sea surface temperature response to the MJO is well known. • But what about salinity? • Is there any signal in temperature or salinity below the mixed layer? • Matthews et al. (December 2007, Science) showed a case study of a prominent MJO in the Pacific Ocean using Argo temperature. • Here I will focus on compositing anomalies in the Argo temperature and salinity data set from 2003 to 2006 inclusive.
Gridding the irregular Argo profiles • 1°longitude x 1° latitude horizontal resolution • 5 dbar vertical resolution • 7 day time resolution • Gaussian weighting function for horizontal gridding scheme, with 1000-km zonal and 250-km meridional length scales. SST
The mean temperature field from ArgoAt 5 m (top) and along equator (bottom)
The mean salinity field from ArgoAt 5 m (top) and along equator (bottom)
Removing the annual and semiannual harmonics to produce the anomaly fieldAn example of the SST record at a gridpoint
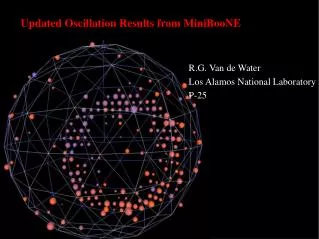
Phase diagram: Real-time Multivariate MJO series 1 (RMM1) and 2 (RMM2) Wheeler and Hendon (2004)
blank Composites of Outgoing Longwave Radiation (OLR) 1 5 1 week apart 2 6 3 7 8 4 W m-2 cloudy/wet clear/dry
blank Composites of OLR and wind stress anomalies 1 5 2 6 3 7 8 4 W m-2 cloudy/wet clear/dry
Composites of Argo temperature anomalies along the equator Indian Ocean Pacific Ocean Indian Ocean Pacific Ocean 1 5 2 6 3 7 8 4 blank °C
Composites of Argo temperature anomalies along the equator Indian Ocean Pacific Ocean Indian Ocean Pacific Ocean 1 5 2 6 3 7 8 4 blank °C
Composites of Argo salinity anomalies along the equator Indian Ocean Pacific Ocean Indian Ocean Pacific Ocean 1 5 2 6 3 7 8 4 blank x 10 -3
Composites of Argo salinity anomalies along the equator Indian Ocean Pacific Ocean Indian Ocean Pacific Ocean 1 5 2 6 3 7 8 4 blank x 10 -3
Longitude-time diagram of Argo temperature anomalies at 850 m averaged 5°N – 5°S Indian Ocean No Kelvin wave Pacific Ocean Kelvin wave of speed 2.5 m s-1 °C
Longitude-time diagram of Argo anomalies of depth of 20°C isotherm averaged 5°N – 5°S m
Vertical displacement deduced from temperature Indian Ocean Pacific Ocean Indian Ocean Pacific Ocean 1 5 2 6 3 7 8 4 m
Vertical Displacement deduced from salinity Indian Ocean Pacific Ocean Indian Ocean Pacific Ocean 1 5 2 6 3 7 8 4 m
Meridional trapping consistent with equatorial Kelvin wave theory °C Temperature anomaly
Ocean response to the MJO • Pacific Ocean • Equatorial Kelvin wave response to MJO wind stress • vertical displacements of ~10 m at > 1000 m • amplitude of variability comparable to the annual cycle • Indian Ocean • exhibits dynamical response • no distinct wave propagation
With grateful thanks to • Thai government and UEA for studentship funding • Everyone involved in the Argo programme!