Download
1 / 1
10 likes | 119 Views
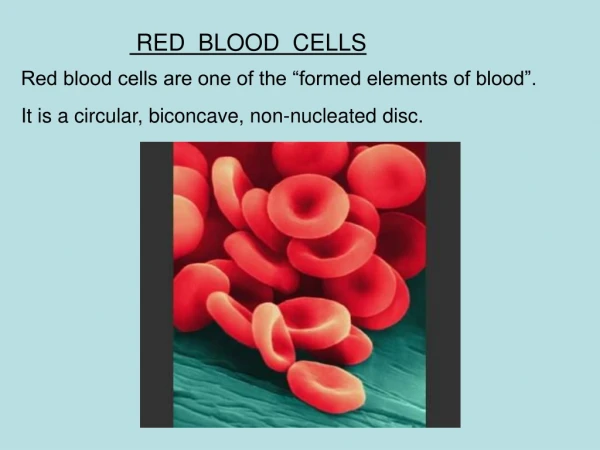
The Age of Red Cells at Transfusion: One Facility’s Experience Suzanne H. Butch, MT(ASCP)SBB and Laura Cooling, MD, MS Blood Bank & Transfusion Service, Department of Pathology University of Michigan Hospitals and Health Centers Ann Arbor, Michigan.

E N D
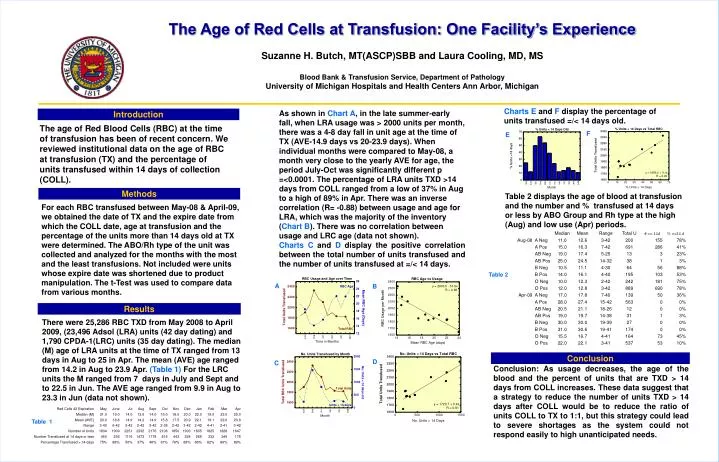
The Age of Red Cells at Transfusion: One Facility’s Experience Suzanne H. Butch, MT(ASCP)SBB and Laura Cooling, MD, MS Blood Bank & Transfusion Service, Department of Pathology University of Michigan Hospitals and Health Centers Ann Arbor, Michigan Charts E and F display the percentage of units transfused =/< 14 days old. As shown in Chart A, in the late summer-early fall, when LRA usage was > 2000 units per month, there was a 4-8 day fall in unit age at the time of TX (AVE-14.9 days vs 20-23.9 days). When individual months were compared to May-08, a month very close to the yearly AVE for age, the period July-Oct was significantly different p =<0.0001. The percentage of LRA units TXD >14 days from COLL ranged from a low of 37% in Aug to a high of 89% in Apr. There was an inverse correlation (R= -0.88) between usage and age for LRA, which was the majority of the inventory (Chart B). There was no correlation between usage and LRC age (data not shown). Charts C and D display the positive correlation between the total number of units transfused and the number of units transfused at =/< 14 days. Introduction The age of Red Blood Cells (RBC) at the time of transfusion has been of recent concern. We reviewed institutional data on the age of RBC at transfusion (TX) and the percentage of units transfused within 14 days of collection (COLL). F E Methods Table 2 displays the age of blood at transfusion and the number and % transfused at 14 days or less by ABO Group and Rh type at the high (Aug) and low use (Apr) periods. For each RBC transfused between May-08 & April-09, we obtained the date of TX and the expire date from which the COLL date, age at transfusion and the percentage of the units more than 14 days old at TX were determined. The ABO/Rh type of the unit was collected and analyzed for the months with the most and the least transfusions. Not included were units whose expire date was shortened due to product manipulation. The t-Test was used to compare data from various months. Table 2 A B Results There were 25,286 RBC TXD from May 2008 to April 2009, (23,496 Adsol (LRA) units (42 day dating) and 1,790 CPDA-1(LRC) units (35 day dating). The median (M) age of LRA units at the time of TX ranged from 13 days in Aug to 25 in Apr. The mean (AVE) age ranged from 14.2 in Aug to 23.9 Apr. (Table 1) For the LRC units the M ranged from 7 days in July and Sept and to 22.5 in Jun. The AVE age ranged from 9.9 in Aug to 23.3 in Jun (data not shown). Conclusion D C Conclusion: As usage decreases, the age of the blood and the percent of units that are TXD > 14 days from COLL increases. These data suggest that a strategy to reduce the number of units TXD > 14 days after COLL would be to reduce the ratio of units COLL to TX to 1:1, but this strategy could lead to severe shortages as the system could not respond easily to high unanticipated needs. Table 1