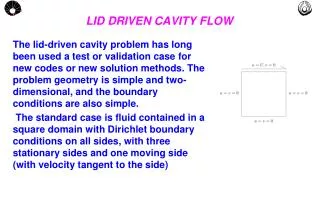
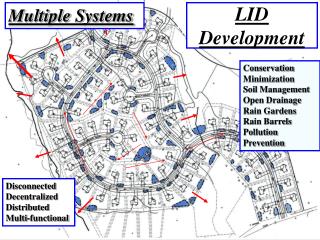
LID Development
Multiple Systems. LID Development. Conservation Minimization Soil Management Open Drainage Rain Gardens Rain Barrels Pollution Prevention. Disconnected Decentralized Distributed Multi-functional.

LID Development
E N D
Presentation Transcript
Multiple Systems LID Development Conservation Minimization Soil Management Open Drainage Rain Gardens Rain Barrels Pollution Prevention Disconnected Decentralized Distributed Multi-functional
How Does LID Maintain or Restore The Hydrologic Regime? • Creative ways to: • Maintain / Restore Storage Volume • interception, depression, channel • Maintain / Restore Infiltration Volume • Maintain / Restore Evaporation Volume • Maintain / Restore Runoff Volume • Maintain Flow Paths • Engineer a site to mimic the natural water cycle functions / relationships
Key LID Principles “Volume” “Hydrology as the Organizing Principle ” • Unique Watershed Design • Match Initial Abstraction Volume • Mimic Water Balance • Uniform Distribution of Small-scale Controls • Cumulative Impacts of Multiple Systems • filter / detain / retain / use / recharge / evaporate • Decentralized / Disconnection • Multifunctional Multipurpose Landscaping & Architecture • Prevention
Defining LID Technology Major Components 1. Conservation (Watershed and Site Level ) 2. Minimization (Site Level) 3. Strategic Timing (Watershed and Site Level) 4. Integrated Management Practices (Site Level) Retain / Detain / Filter / Recharge / Use 5. Pollution Prevention Traditional Approaches
Bioretention / Rain Gardens Strategic Grading Site Finger Printing Resource Conservation Flatter Wider Swales Flatter Slopes Long Flow Paths Tree / Shrub Depression Turf Depression Landscape Island Storage Rooftop Detention /Retention Roof Leader Disconnection Parking Lot / Street Storage Smaller Culverts, Pipes & Inlets Alternative Surfaces Reduce Impervious Surface Surface Roughness Technology Rain Barrels / Cisterns / Water Use Catch Basins / Seepage Pits Sidewalk Storage Vegetative Swales, Buffers & Strips Infiltration Swales & Trenches Eliminate Curb and Gutter Shoulder Vegetation Maximize Sheet flow Maintain Drainage Patterns Reforestation……………….. Pollution Prevention………….. LID Practices (No Limit!) “Creative Techniques to Treat,Use, Store, Retain, Detain and Recharge”
LID Hydrologic Analysis Dr. Mow-Soung Cheng Compensate for the loss of rainfall abstraction Infiltration Evapotranspiration Surface storage Time of travel
LID Design Procedure Highlights • Site Analysis • Determine Unique Design Storm • Maintain Flow Patterns and Tc • Conservation and Prevention • Develop LID CN • Compensatory Techniques. Stress Volume Control then Detention or Hybrid for Peak
Low-Impact Development Hydrologic Analysis and Design • Based on NRCS technology, can be applied nationally • Analysis components use same methods as NRCS • Designed to meet both storm water quality and quantity requirements
Hydrograpgh Pre/ Post Development Developed Condition, Conventional CN (Higher Peak, More Volume, and Earlier Peak Time) Q Existing Condition T
Detention Peak Shaving Developed Developed Condition, with Conventional CN and Controls Q Existing Peak Runoff Rate Additional Runoff Volume Existing T
Minimize Change in Curve Number Developed- No Controls Reduced Qp Developed Condition, with LID- CN no Controls. Reduced Runoff Volume Q Existing T
Maintain Time of Concentration Developed, LID-CN no controls Reduced Qp Developed, LID- CN no controls same Tc as existing condition. Q More Runoff Volume than the existing condition. Existing T
Reducing Volume Provide Retention storage so that the runoff volume will be the same as Predevelopment Retention storage needed to reduce the CN to the existing condition = A2 + A3 A1 Q A2 A3 T
Detention Storage Provide additional detention storage to reduce peak discharge to be equal to that of the existing condition. Q Predevelopment Peak Discharge Existing T
Comparison of Hydrographs Increased Volume w/ Conventional Conventional Controls Q LID Concepts A2 Existing A3 T
1 Hydrograph Summary 1 Existing Developed, conventional CN, no control. 2 3 Developed, conventional CN and control. 4 Developed, LID-CN, no control. 5 Developed, LID-CN, same Tc. 4 5 Pre-development Peak Runoff Rate 6 Developed, LID-CN, same Tc, same CN with retention. Q 6 7 Same as , with additional detention to maintain Q. 2 7 3 6 T
Comparison of Conventional and L I D Curve Numbers (CN) for 1- Acre Residential Lots Conventional CN 20 % Impervious 80 % Grass Low Impact Development CN 15 % Impervious 25 % Woods 60 % Grass Curve Number is reduced by using LID Land Uses. Disconectiveness CNC=CNP+[PIMP] (98-CNP) (1-0.5R) 100 CNCC= Composit CNP= Pervious R=Ratio Unconnected imp. to total imp PIMP = Percent of imp. site
LI D to Maintain the Time of Concentration“Uniformly Distributed Controls” * Minimize Disturbance * Flatten Grades * Reduce Height of Slopes * Increase Flow Path * Increase Roughness “ n “
Retention LID Storage Options(On-Site) * Infiltration * Retention * Roof Top Storage * Rain Barrels * Bioretention * Irrigation Pond
Determining LID BMP Sizing 8% BMP
Methods of Detaining Storage to Reduce Peak Runoff Rate * Larger Swales with less slope * Swales with check dams * Smaller or constricted drainage pipes * Rain barrels * Rooftop storage * Diversion structures
LID Techniques and Objectives Low-Impact Development Technique
Maintain Time ofConcentration (Tc) Low-Impact Development Technique X X X X X X X
Summary of LID Techniques (1) Recalculate Postdevelopment CN based on LID land use. (2) Increase Travel Time (TT) using LID techniques to achieve the same Tc as Existing conditions. (3) Retention: Provide permanent storage (Infiltration/Retention) using LID techniques to maintain the CN and runoff volume of existing conditions. (4) Detention: Provide additional detention storage to maintain the same peak discharge as existing conditions.
Physical Processes in LID • Continuous rainfall • Interception • Surface ponding • Evapotranspiration • Infiltration • Soil pore space storage • Interflow • Groundwater recharge • Overland flow • Channel and pipe flow • Pollutant generation • Pollutant removal by physical, chemical, and biological processes • Runoff temperature moderation
The Ideal LID Model • Continuous simulation • Small (lot size) and large (watershed) area • Suitable for new development and re-development • Watershed protection criteria • Models all hydrologic components in catchment • Models all flow components in BMPs • Urban conditions (e.g., pipe flow, regulators) • Detailed land use description • Many BMP options: • Land-use planning • Conventional • LID • Programmatic (e.g., street sweeping) • Allows for “precision” placement of BMPs • BMP optimization
The Ideal LID Model (ctd) • Variety of pollutant generation and removal processes: • Physically-based equations • Unit processes • BMP treatment train • Field data probability distributions • GIS interface • Various output stats (e.g., duration curves) • Output to: • Instream water quality models • Ecosystem models • Planning and design • User-friendly • Well documented • Interactive
Conventional Hydrologic Models • Developed for flooding (large storms), suitable mainly for peak flows • Intended for large drainage areas • Lumped parameters, do not allow for precise placement of stormwater controls • Weak infiltration modeling in some models • Submodels do not represent physical phenomena present in LID • Complex
Available Models • TR-20/TR-55, HEC-HMS • SWMM • HSPF • SLAMM • Prince George’s County’s BMP model for LID • MUSIC • LIFE™ • SET
TR-20/TR-55, HEC-HMS • Developed by USDA and USACE respectively • Intended for large storm events • Lumped parameters applicable to large drainage areas • Single event simulation • Unable to evaluate micro-scale BMPs • No pollutant generation and removal capabilities • Not suitable for LID
SWMM(EPA Stormwater Management Model) • Wayne Huber, Oregon State U.; & CDM • Best suited for urban hydrology and water quality simulation • Robust conveyance modeling • Wide applicability to large and medium watershed hydrology • Current version (v. 4.4h) can be “adapted” to simulate LID controls using generic removal functions • Latest beta version (v. 5) capable of simulating some LID BMPs
HSPF(Hydrologic Simulation Program - FORTRAN) • EPA program for simulation of watershed hydrology and water quality • Maintained by AquaTerra as BASINS • Produces time history of the quantity and quality of runoff from urban or agricultural watersheds • Best suited for rural hydrology and water quality simulation • Data intensive, lumped parameter model • Wide applicability to large watershed hydrology • Models effects in streams and impoundments • BMPs simulated as reductions in pollutant load • Latest beta version (v. 5) capable of simulating some LID BMPs • Not recommended for LID
SLAMM(Source Loading and Management Model) • Dr. Robert Pitt, U. of Alabama, John Voorhees • Evaluates pollutant loadings in urban areas using small storm hydrology • Heavy reliance on field data • 6 land uses (residential, commercial, industrial, highway, ...) • 14 source area types (sidewalks, roofs, parking, turf, unpaved areas ...) • 8 BMP types (infiltration, biofiltration, swales, pervious pavement, ponds, …) • Calculates runoff, particulate, and pollutant loading for each land use and source area • Routes particulate loadings through drainage system, to BMPs and outfalls
Prince George’s County BMP Model • Uses HSPF to derive flow, pollutant loads • Applies flow and loads to LID BMPs • Two generic BMPs: storage/detention, channel • Simulates flow processes in each BMP • Water quality processes simulated as first-order decay and removal efficiency
MUSIC • Tony Wang, Monash U., Australia • Simulates hydrology, water quality (TSS, TN, TP, debris) • Scale from city blocks to and large catchments • Aimed and planning and conceptual design of SWM systems • User-friendly interface • Event or continuous simulation • Sources: urban, ag, forest • BMPs: buffers, wetlands, swales, bioretention, ponds, GPT (gross pollutant traps) • Pollutant removal by first-order kinetics • Australia default parameters from worldwide research • Extensive output statistics
LIFETM(Low Impact Feasibility Evaluation Model) • Specifically developed by CH2M HILL to simulate LID microhydrology • Models water quantity (volume, peak flows) and water quality • Physically-based, continuous simulation • New development and redevelopment • Numerous controls: bioretention, green roofs, rainwater cisterns, pervious pavements, infiltration devices... • Optimization module balances competing priorities • Drag-and-drop user friendly interface, GIS linkage
BMP Evaluation Method Existing Flow & Pollutant Loads HSPF LAND SIMULATION – Unit-Area Output by Landuse – BMP Module SITE-LEVEL LAND/BMP ROUTING Simulated Surface Runoff BMP DESIGN Simulated Flow/Water Quality Improvement Cost/Benefit Assessment of LID design – Site Level Design –
BMP Class A: Storage/Detention Evapotranspiration Outflow: Inflow: Modified Flow & Water Quality From Land Surface Overflow Spillway Storage Bottom Orifice Underdrain Outflow Infiltration
3 connect objects 1 click-and-drag 2 edit attributes The Interface Landuse Menu BMP Menu
General Assessment of BMP Effectiveness Storm Volume (in) 0.180 0.380 0.420 0.790 1.260 2.080 2.390 Peak Flow Reduction 2_1 90.3% 94.7% 98.0% 90.9% 82.1% 69.3% 45.7% Peak Flow Reduction 6_2 89.7% 95.3% 98.3% 94.4% 91.1% 88.8% 64.0% BMP 2_1 BMP 2_1 in series with BMP 6_2 100% 80% 60% BMP Peak Flow Reduction 40% 20% 0% 0.0 0.5 1.0 1.5 2.0 2.5 Storm Volume (in)
Vegetated Swale Buffer Strip Dry & Wet Detention Pond Infiltration Gross Pollutant Trap Wetlands Source Node Vegetated Swale