Download

1 / 21
210 likes | 346 Views
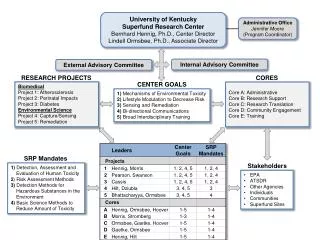
Discussion on applications and research projects. Outline. Applications activities, including sectors, lead times, and forecast tailoring. Use of selected case studies, such as floods, droughts, heat waves etc.

E N D
Outline • Applications activities, including sectors, lead times, and forecast tailoring. • Use of selected case studies, such as floods, droughts, heat waves etc. • Research activities, including calibration, multi-model ensembles, ensemble generation and spread, forecast intercomparisons, sources of predictability.... • We need to be sure we are archiving all reasonable variables needed for applications. • How should the use of the dataset for research and applications be promoted? • Input from various centres has been sought.
Growing, and urgent, requirement for the employment of sub-seasonal predictions for a wide range of societal and economic applications which include: • Warnings of the likelihood of severe high impact weather (droughts, flooding, wind storms etc.) to help protect life and property • Humanitarian Planning and Response to disasters • Agriculture particularly in developing countries — e.g. wheat and rice production • Disease planning/control — e.g. malaria, dengue and meningitis • River-flow — for flood prediction, hydroelectric power generation and reservoir management for example
Weather and climate span a continuum of time scales, and forecast information with different lead times are relevant to different sorts of decisions and early-warning • In agriculture, for example, a seasonal forecast might inform a crop-planting choice, while sub-monthly forecasts could help irrigation scheduling, pesticide/fertilizer application: both can make a cropping calendar dynamic. • In situations where seasonal forecasts are already in use, sub-seasonal ones could be used as updates, such as for end-of-season crop yields. • Sub-seasonal forecasts may play an especially important role where initial conditions and intraseasonal oscillation is strong, while seasonal predictability is weak, such as the Indian summer monsoon.
Food security early warning, planning growing season EVENT seasonal forecast marketing anthesis Farmer advisories planting harvest Input supply management Insurance evaluation, payout Insurance contract design Trade planning, strategic imports Uncertainty (e.g., RMSEP) Time of year The agricultural risk & planning calendar APPLICATION Risk analysis J. Hansen et al. (IRI)
rice rice Fallow Cropping Pattern Rainfall (mm) Planting Area (ha) Rice-planting area in Indramayu, Java Start of planting changes from time to time, in planting season 97/98, start of planting delayed 1 month due to delay onset of rainfall, increasing drought risk for the second crop, except in La-Nina years Source: Boer et al. (2004)
Examples of Ongoing Applications Activities • Environment Canada: • Forecast of extreme agrometeorological indices across Canada. Right now, we are doing this with the 16-day ensemble forecasts. We plan to apply to the monthly system. • Hydrometeorological forecast for the Great Lakes. It is run in an experimental mode. One component is to use the monthly ensemble forecast to force the hydrological model. • ECMWF — 3 European projects: • SafeWind (wind ensemble forecasts for the energy sector). Medium-range focus, but interest in the sub-seasonal time scale. • Applications in hydrology and real-time flood forecasting, using ECMWF monthly forecasting system, demonstrated useful skill. Also use TIGGE. • Prediction of African rainfall and temperature for disease prevention (Malaria, Dengue, Yellow fever..) (QWECI). • CAWCR/BoM: • Prediction of heat waves, including understanding of the role of large-scale circulation as pre-cursor, ability forecast model to capture these larges scale drivers, and development of some experimental prediction products. Funded by an agricultural consortium.
UKMO: • Predictability of the temporal distribution of rainfall through the seasons, with specific reference to Africa (e.g. season onset, cessation, risk of in-season dry spells). Currently seasonal system; preliminary look at this in the ECMWF monthly system. • Frequency of daily temperature extremes & 'heatwaves' also of interest & rainfall extremes over Africa. • Reservoir inflow forecast for Ghana, on seasonal timescale. • Sudden stratospheric warmings also of interest for European winter cold spells. • NCEP • MJO & Global Tropical Hazard • Prediction of consecutive days of extreme temperature • Prediction of Blocking and circulation indices • Prediction of Tropical storms and Atlantic Hurricanes • Prediction of onset dates of various monsoon systems • Prediction of Active/break phases of Indian monsoons • Prediction of sudden stratospheric warming events • JMA • Heatwave and flood prediction on a sub-seasonal time scale
Data Needs for Applications • Availability of long hindcast histories are needed to develop and test regression-based “MOS” and tailoring models, and for skill estimation which is critical to applications. • Daily data is needed, especially for a few key variables including precipitation and near-surface temperature and windspeed. • Issues of open data access to enable uptake
Verification and inter-comparison of the sub-seasonal forecasting systems • also comparing the skill with seasonal forecasting systems (at some centers have different type of initialization, different resolutions...) • Multi-model combinations, Calibration • Defining a metric for sub-seasonal forecasts • Prediction and predictability of extreme events: summer heat waves, winter cold waves, flooding, tropical cyclones... • Investigating sources of predictability, e.g.: • impact of sea-ice, snow, soil moisture initial conditions on sub-seasonal predictions... • impact of the MJO on extratropical circulation • modulation of tropical cyclones by the MJO • stratosphere-troposphere interaction
Processes that act as sources of ISI climate predictability extend over a wide range of timescales, and involve interactions among the atmosphere, ocean, and land. CCEW: convectively coupled equatorial waves (in the atmosphere); TIW: tropical instability wave (in the ocean); MJO/MISV: Madden-Julian Oscillation/Monsoon intraseasonal variability; NAM: Northern Hemisphere annular mode; SAM: Southern Hemisphere annular mode; AO: Arctic oscillation; NAO: North Atlantic oscillation; QBO: quasi-biennial oscillation, IOD/ZM: Indian Ocean dipole/zonal mode; AMOC: Atlantic meridional overturning circulation. For the y-axis, “A” indicates “atmosphere;” “L” indicates “land;” “I” indicates “ice;” and, “O” indicates “ocean.”
Example of the relationship among tropical outgoing long-wave radiation (OLR, left column), which is used to define the phase of the MJO, wintertime (JFM) 500-hPa geopotential height anomalies (middle column), and precipitation anomalies (right column). For example, Phase 5 (the middle row) of the MJO exhibits enhanced convection over the Maritime Continent that is accompanied by deep-troughing in the mid-troposphere over the North Pacific and enhanced precipitation in the Pacific Northwest. SOURCE: Adapted from Bond and Vecchi (2003).
http://www.meted.ucar.edu/tropical/textbook/ from COMET training materials
Stratospheric impact on weather? Fig. 2. Composites of time-height development of the northern annular mode for (A) 18 weak vortex events and (B) 30 strong vortex events. The events are determined by the dates on which the 10-hPa annular mode values cross –3.0 and +1.5, respectively. The indices are nondimensional; the contour interval for the color shading is 0.25, and 0.5 for the white contours. Values between –0.25 and 0.25 are unshaded. The thin horizontal lines indicate the approximate boundary between the troposphere and the stratosphere. Baldwin & Dunkerton (2001)
Inertial memory due to soil moisture A positive soil moisture anomaly at the Atmospheric Radiation Measurement/Cloud and Radiation Testbed (ARM/CART) site in Oklahoma decreases with a time scale much longer than the atmospheric events that caused it. SOURCE: Greg Walker, personal communication. Soil moisture time scales measured at other sites are even longer than this (Vinnikov and Yeserkepova, 1991).
Areas for which the numerical models participating in the GLACE study tend to agree that variations in soil moisture exert some control on variations in precipitation. The variable plotted is the average across models of a land-atmosphere coupling strength diagnostic; the insets show how the magnitude of this diagnostic differs amongst the participating models. SOURCE: Koster et al. (2004).