Download
1 / 36
360 likes | 502 Views
This study explores the motivations behind business environmental management (BEM) in Oregon, driven by increasing environmental challenges and regulatory pressures. It analyzes factors influencing firms' decisions to adopt sustainable practices, including cost reduction, legal risk management, and stakeholder relations. By surveying various industries, the research identifies key drivers and barriers to effective environmental management, offering insights into the role of the public sector and the effectiveness of voluntary initiatives. The findings aim to inform business strategies and public policies that promote sustainability.

E N D
What Motivates Business Environmental Management: Sticks, Carrots or Both?David ErvinProfessor, Environmental Studies, Portland State UniversityCody JonesGraduate Research Assistant, Portland State UniversityNovember 16, 2007
Context for Greening Business • Environmental problems are widespread and demand for environmental quality continues to grow • Environmental regulatory compliance and enforcement costs trending higher with greenhouse gas controls yet to come • More NGOs see limits in using legislation and the courts and favor more collaborative approaches • Increasing number of firms perceive revenue and cost rewards for being green (e.g., ISO 14001) • Net effect – More responsibility for environmental management is shifting to the business sector and NGOs
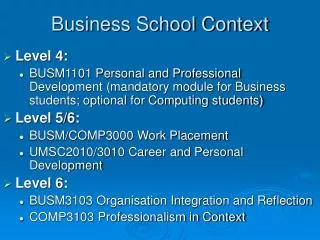
“Oregon Business Decisions for Environmental Management (OBDEM)” • Funded by the U.S. EPA Program on Corporate Environmental Behavior and Effectiveness of Government Intervention • June 2003 – September 2007 • Three universities: PSU, OSU, UIUC • Comprehensive survey of environmental management in Oregon • Informing public policy to foster voluntary environmental management efforts at for-profit organizations
Motivations for BEM • Reduce cost (waste) • Increase productivity • Mitigate or preempt environmental regulations • Access and serve ‘green’ markets
Motivations for BEM • Manage legal and financial risks • Improve relations with stakeholders, e.g., community, labor • Manage competitors (first-mover advantage) • Owner/CEO personal preferences
Research Questions • What motivations are most important in prompting environmental management for which firm types? • Do formal and informal voluntary environmental management strategies appeal to different types of firms? • Does business-led environmental management improve environmental performance? • What role(s) can the public sector play in furthering cost-effective ‘voluntary’ business environmental management?
Sample and Survey • Facility level data • Six industrial sectors • Wood products manufacturing • Food manufacturing • Electronics manufacturing • Truck transportation • Construction of buildings • Accommodation (hotels, etc.)
Sample and Survey cont’d • Identified environmental management motivations, practices, and performance measures from literature and industry interviews • Survey topics • Environmental management motivations and barriers • Facility environmental practices • Facility environmental performance • General information, e.g. annual revenues, management age
Sample Ordered Response Question Please indicate the extent each of the following factors has influenced environmental management at your facility in the last 5 years. (Please check only ONE box for each factor.) No Great Do Not InfluenceInfluenceKnow ▼ ▼ ▼ ▼ ▼ ▼ a. Customer desire for environmentally friendly products and services 1 2 3 4 5 D b. Customer willingness to pay higher prices for environmentally friendly products/services. 1 2 3 4 5 D
100 87 85 84 83 83 81 80 60 40 Study sample Washington 20 Montana Oregon Idaho U.S. 0 Respondents • 689 responses • 35.1% response rate • Construction: 34.3% • Food: 37.1% • Wood: 37.2% • Electronics: 34.2% • Transport: 37.3% • Accommodation: 29.9% • 31 of 36 counties • Small facilities • 89% privately held • 79% independent Establishments (facilities) with <100 employees (2000 Census)
Selected General Findings • Characteristics • 54% reported > 6 competitors • 42% percent sell directly into retail • 13% reported some R&D capacity • 2.4%of revenues spent on environmental management on average • 42% reported at least one regulatory inspection in 2004 • 2% reported at least one penalty, lawsuit, or infraction in 2004
Selected General Findings cont’d • Values • The highest average rating was for the idea that facility upper management has a moral responsibility to protect the environment. • The highest rated priority was complying with current regulations. • The least important influence was environmental interest groups. • Cost was the most important barrier to environmental management, followed by time.
Environmental Mgmt Practices (EMPs) • 60% had implemented at least one practice • Environmental training for employees • Internal environmental standards • Documented environmental policy • Well-defined environmental goals • Regular environmental audits • Green purchasing policy • Environmental cost accounting • Environmental standards for suppliers • Periodic publishing of environmental results • Employee compensation for environmental performance
EMP Intensity/Effectiveness • Mean = 2.7, SD = 1.2 • Continuous efforts • Employee awareness • Adequacy of training • Goals guide decisions • Standards above regulation • Well-defined procedures • Audits for own goals • Standards for suppliers • Public reporting • Environmental cost accounting • Employee incentives
Pollution Prevention Efforts • Mean = 3.8, SD = 1.1 • Reduction of spills and leaks is emphasized. • Recycling has increased and landfilling has been reduced. • Pollution prevention is emphasized to improve environmental performance. • Production systems have been modified to reduce waste. • Products have been modified to reduce environmental impacts. • Raw materials are chosen to reduce impacts.
Poisson Regression of Types of Environmental Management • Environmental Management Practices • Employee training, internal environmental standards • Avoid certification costs • Flexible solutions • Voluntary Environmental Management Programs (VEPs) • ENERGY STAR, LEED, ISO 14001 • 22% reported participating • Public recognition, consumer education • High cost, prepackaged solutions
Poisson Regression – Number of Environmental Practices (EMPSUM)
Poisson Regression – Number of Environmental Practices (EMPSUM)
Poisson Regression – Number of Voluntary Programs (VEPSUM)
Poisson Regression – Number of Voluntary Programs (VEPSUM)
Summary of Influences • Facilities more likely to implement practices or participate in programs (common influences) • Larger facilities • Facilities that perceive environmental issues as a significant concern • Facilities regulated on a greater number of impacts • Facilities more likely to implement practices • Publicly traded, multinational corporations • Facilities regulated on any impact • Wood and Transport, compared to Construction • Facilities more likely to participate in VEPs • Facilities with fewer competitors • Facilities regulated on solid waste • Construction facilities
Environmental Performance • Impacts queried • Wastewater and dewatering discharge • Solid waste and recycling • Hazardous or toxic wastes • Carbon dioxide (CO2) emissions • Hazardous air emissions • Electricity and natural gas (selected) • Green building/energy efficiency (construction) • Diesel and biodiesel use (transport) • Measures: outcomes, compliance, changes • Outcomes received the lowest response rates (from 2% to 94%)
Bivariate Performance Results • Solid waste: VEPPs recycled 59%, NPs averaged 44% • Energy efficient equipment in Construction: VEPPs averaged 54%, NPs averaged 32% • Green building in Construction: VEPPs averaged 28%, NPs averaged 9% • Overcompliance for at least one impact: 57% of VEPPs versus 30% of NPs • Improvements during 2004: 80% of VEPPs vs 54% of NPs • Most changes were minimal (1-3%)
Basic Economics of BEM • Choices of EMPs and P2 actions depend on their expected utility to managers and other benefits compared to costs/barriers. • Expected benefits (utility and monetary) are approximated by relative responses to various motivation questions. • Expected costs/risks are captured by the responses to strength of various barriers. • Environmental performance depends on the expected relative benefits and costs for each facility over time.
Preliminary Multivariate Analysis • Facility environmental management includes three inter-related decisions • Select environmental management policies/practices (EMPs) (Q 12) • Choose extent of environmental and pollution prevention (P2) actions (Q 14) • Environmental performance depends on intensity of environmental practices, extent of environmental action, and other factors (analysis underway)
Analytical Approach • Use principal components (PC) to estimate indices (0 ≤ I ≤ 1) for environmental policies/practices, actions, and performance • Use PC also to estimate indices for various motivations and barriers • Estimate recursive system of two equations in which EMPs depend on motivations and other facility characteristics, and P2 actions depend on EMPs and other factors. • Econometric (3SLS) methods
Preliminary Findings for Environmental Policies/Practices • Favorable upper management attitudes toward environment show the largest positive influence. • Competitiveness, regulatory and investor pressures also exert significant effects. • A composite of barriers (e.g., upfront costs) significantly decrease EMP intensity. • Consumer and interest group pressures, and facility characteristics are insignificant .
Preliminary Findings for Pollution Prevention Actions • EMP intensity shows a significant and positive effect on P2 action. • Management attitudes, competitiveness, regulatory, and investor pressures and barriers exert indirect positive impacts via their effects on EMPs • Environmental agency inspection in 2004 exerts a separate and significant positive effect. • Facility R&D exerts a marginally significant negative effect on P2 intensity?
Preliminary Implications • The commitment to environmental policies/practices (EMPs) is shaped heavily by upper management attitudes and market pressures, (e.g. competitors, investors). • The level of environmental (P2) action is significantly influenced by the degree of EMP commitment and regulatory pressure. • The absence of significant effects by facility characteristics, e.g., size, when motivations and barriers are properly controlled for, is notable.
Future Analysis • Checking for self-selection and non-respondent bias • Delineate ‘voluntary’ environmental practices and action, and the significant influences on them • Probe sector differences • Augment reported environmental performance with secondary data • Test the influences on environmental performance, and the relationships with environmental practices and action
Publications • Project Website • http://obep.research.pdx.edu/ • “Reports” • OBDEM Summary Report • Hall, Teresa, “Business Decisions for Voluntary Environmental Management: Motivations, Actions and Outcomes,” M.S. Thesis, Oregon State University, 2006. • Jones, Cody, “Voluntary Environmental Program Participation in Oregon: Summary Statistics,” MEM report, Portland State University, 2007. • “Motivations for Voluntary Environmental Management,” Policy Studies Journal (forthcoming)