Download
1 / 42
440 likes | 586 Views
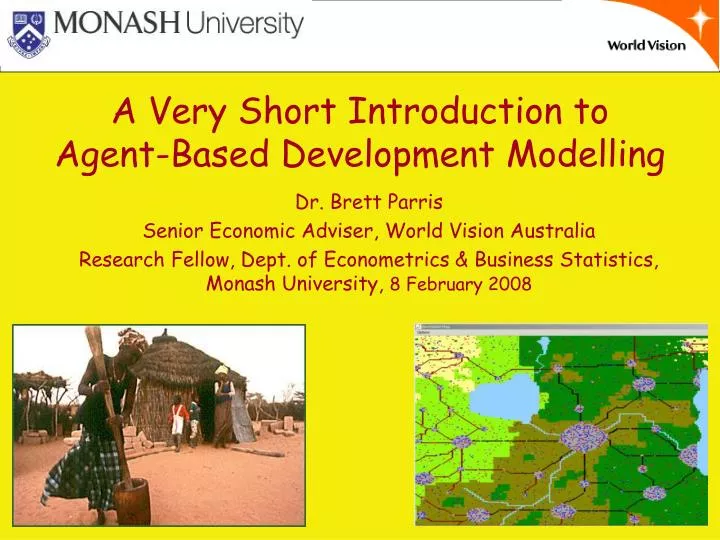
A Very Short Introduction to Agent-Based Development Modelling. Dr. Brett Parris Senior Economic Adviser, World Vision Australia Research Fellow, Dept. of Econometrics & Business Statistics, Monash University, 8 February 2008. What are Agent-Based Models?.

E N D
A Very Short Introduction to Agent-Based Development Modelling Dr. Brett Parris Senior Economic Adviser, World Vision Australia Research Fellow, Dept. of Econometrics & Business Statistics, Monash University, 8 February 2008
What are Agent-Based Models? • Dynamic computer simulations involving interactions between discrete heterogeneous ‘agents’. • ABMs are based on object-oriented computer programming: i.e agents are ‘objects’, encapsulating both attributes (data) and methods (actions). • Agents can represent anything: people, firms, governments, land types, pathogens. • Agents interact with each other and their environment according to rules which may themselves evolve. • The system evolves dynamically – it need not converge to an ‘equilibrium’ • ABMs can be non-spatial (a ‘soup’) or spatial – naturally incorporating real Geographic Information Systems (GIS) data or realistic network structures. • Models run thousands of times to get probabilistic ‘landscape’ of outcomes. Handbook published 2006 23 chapters
Where are ABMs being used? • Combat simulation • Terrorism research • Peacekeeping • Transport & logistics • Operations research … and combinations thereof. • Ecology • Geography • Epidemiology • Political science • Anthropology • Economics • Finance • Innovation and organisation theory • Hundreds of papers now published – many in top journals: Nature, Science, PNAS, The Lancet, even AER, Economic Journal. ABMs naturally lend themselves to multidisciplinary studies since they can seamlessly integrate the social, political, legal, economic, environmental, geographic and epidemiological dimensions of development.
Modelling economic development • I am particularly interested in whole-economy models & models which are used to guide policy & explain how economy works: i.e. why some policies should be adopted in real world & not others, & in what sequence. • Two broad approaches to modelling economic development processes: top-down & bottom up. • Critical difference is where they start.
Different kinds of models • Closed-form analytic models are not the only kind of models scientists use. • For some systems a deductive axiomatic analytic approach (like mathematical philosophy) is not appropriate. • Eg. Geology – models (maps) of earth composition & structure based on: • Detailed field mapping of real world systems • Informed by extensive taxonomies of rock types • Observations of equivalent processes elsewhere • Lab experiments on effects of temp, pressure etc
What kind of system are we dealing with? Neat separation of micro and macro causal networks? • Homogeneous agents interacting with same strengths • Complete causal network at macro-level • Neat separation of micro & macro analysis. • Analytic or statistical mechanical approach OK because system is ergodic – no one state has any higher pr than another.
Or is it more like this? Interleaving of micro and macro causal networks • Heterogeneous, agents interacting with varying strengths & even asymmetrically. • Emergent macro-variables influencing micro-entities Eg. business confidence, “irrational exuberance”, interest rates etc. • Incomplete causal network at macro-level • Analytic or statistical mechanical approach not OK – system non-ergodic - have to integrate too many equations of motion. “Well, I’ve got to tell you: I’ve never really understood macro. What I mean by this is that my idea of understanding is having a model that captures what is going on. In macro we don’t have that; instead we have empirical generalizations, and those generalizations tend to break down quite quickly.” - Ken Arrow (in Colander et al. 2004).
Why agents? • Many assumptions of analytic models are not appropriate for development modelling. E.g. • Perfect information & foresight • Representative agents (eg. single HH for country), ignoring growth & development of children • Infinite computational capacities of all agents • Complete markets & networks for goods, services, capital, risk • Costless redeployment of labour • Zero corruption & costlessly enforced contracts & property rights • Comparative statics rather than evolutionary dynamics • Irrelevance of money & finance (eg. barter models of trade) • Use of optimisation over real number field (R+) rather than integer optimisation of prices & quantities. Real optimisation is not a good approximation for Diophantine (integer) optimisation problems. It cannot be known in advance whether given Diophantine problem has a solution in integers (Hilbert’s 10th problem, proven in 1970 that there is no solution.)
Why agents? • In making a simple analytic model more complex, it is often not possible to relax enough assumptions simultaneously and still remain tractable. • Model has to be simulated – either equation-based or agent-based simulation. Agent-based models can relax more assumptions. • The solvability of mathematical models Source: Keen (2001, Table 12.1, p. 265) adapted from Costanza (1993, p. 33).
ABMs & Parameters • A lot of statistical & econometric work required for ABMs, in data preparation, parameter specification & output analysis. • Verification & validation of ABMs is an active area of research - eg. best approaches to sample over possible parameter space – Latin hypercube sampling etc. • “[N]umerical errors can be reduced through computation but correcting the specification errors of analytically tractable models is much more difficult. The issue is not whether we have errors, but where we put those errors. The key fact is that economists face a trade-off between the numerical errors in computational work and the specification errors of analytically tractable models.” Ken Judd (2006) Handbook of Computational Economics, Vol. 2, Agent-Based Computational Economics, p. 887.
Estimating parameters • Ratio of wealth to wellbeing = 1 • Cost of evaluating choices = 0 • Firms’ barriers to entry = 0 • Prop. of capital employed = 1 • Mobility of K between countries = 0 • Accuracy of expectations = 1 • Cost of redeploying L = 0 • Rate of skill loss of unemployed L = 0 • Degree of corruption = 0 • Time required for consumption = 0 The assumptions of tractable models are assignments of parameter values.These arbitrary values are no more scientifically valid than the estimations required for ABMs. Often less. • Agent’s rationality = 1 • Agent’s info processing capacity = 1 • Prevalence of mental illness = 0 • Prevalence of addictive behaviour = 0 • Spatial heterogeneity = 0 • Spatial separation of markets = 0 • Cost of travel between markets = 0 • Prop. of agents able to access info = 1 • Info search costs = 0 • Learning costs = 0 • Heterogeneity of preferences = 0 • Rate of change of preferences = 0 • Prop. of contracts enforced = 1 • Cost of contract enforcement = 0 • The parameter estimation problem still exists for tractable models – but it is often dealt with by arbitrarily assigning values of 0 (non-existent) or 1 (perfect) with standard deviation always assumed to be zero. Eg:
Parsimony & Ockham’s razor A tension in model building process: a certain irreducible number of system components and interactions needed to not misrepresent system. Eg. Tractor: how many components needed (and at what level of aggregation?) before we can say we have a model of a tractor rather than a car or a lump or iron? Depends on purpose. Models need clear purpose. Models should be as simple as possible but no simpler. (Einstein) It’s Ockham’s razor, not Ockham’s glue. Direction of movement is cutting away from the more complex to the more simple – while preserving the results. If we’ve never studied complexity of system, & cut it back, preserving results, model is more likely to be simplistic, not simple. “I would not give a fig for the simplicity this side of complexity, but I would give my life for the simplicity on the other side of complexity.” - U.S. Supreme Court Justice, Oliver Wendell Holmes Jr.
Conclusion: What can ABMs contribute to modelling development processes? • Naturally evolutionary dynamics • Seamless integration of economic, political, social, environmental, geographic & epidemiological dimensions. • Heterogeneous agents (age, gender, rationality, health, education etc) • Taxonomies (code libraries) of market types, behaviours, institutions, networks etc., based on existing data, field observations and lab experiments. • Spatial dimension – linked to real GIS, land-use data, epidemiology (malaria zones, etc) • Localised &/or costly information & genuine uncertainty • Bargaining power and price jumps in value chains • Explicit modelling of children’s growth & development. • Natural modelling of integer problems facing economic agents.
ABMs & Policy Work • A lot of concern among complex systems researchers with validation & verification of agent-based models (ABMs) – quite right. • As a consequence – a view that ABMs shouldn’t be used to inform policy – quite wrong IMHO. • Have to look not just at gap between reality and ABMs, but at gap between reality and current models already being used in policy work & also difficulties facing analytic models. • Q not: Are ABMs ‘accurate’? But: Can ABMs offer an improvement on current models? Even if more humility?
So … Yes – models need clear purpose (in this case a model capable of shedding light on effects of trade liberalisation and aid programs in certain sectors) - models should be as simple as possible But … a tension in model building process: a certain irreducible number of system components and interactions. Eg. Tractor: how many components needed (and at what level of aggregation?) before we can say we have a model of a tractor rather than a car or a lump or iron? Depends on purpose … Bottom line: “Models must be as simple as possible but no simpler.” Q: If we wanted to use an ABM to avoid some of these problems, what might it look like?
Emergence vs. accurate time slice Here we are not interested in starting with a very simple system and seeing if it evolves complex emergent structures & behaviours. We are wanting to take a time slice through an existing complex system. Means the system components, relationships, rules of interaction & evolution must all be in place so that system evolves sensibly from t0. Lots of statistical/econometric work in the background to get probabilities as right as possible so that model is set up properly and evolves sensibly.
Bargaining power is fundamental to economic systems There is no Market – but spatially and temporally separated markets with varying degrees of interconnection. Prices/value not just determined by supply and demand but through bargaining by buyers & sellers Asymmetric bargaining power between transactors and along value chains permits jumps in value in the system – there is nothing equivalent to conservation of energy in economic systems. Rural Development: Putting the Last First, Robert Chambers (1983): highlighted the lack of bargaining power of the poor, due to their low levels of literacy and frequent sickness. ABMs can implement these insights
Tanzania Area: 945,090 km2 Population: 35.5 million (2001) GDP per capita: US$266 (2001) Illiteracy: 29% of population
Population structure 10,000 agents generated according to Tanzanian population structure: • age (years) • gender • location (rural/urban) http://www.tanzania.go.tz/ppu/pcomposition.html
Six aggregation decisions Agent scale Time scale Spatial scale Commodity scale 5 & 6. Financial asset scales Key question: How far can we aggregate upwards before losing information critical to model’s purpose? Have to be guided by expert domain knowledge.
1. Agent scale Above individual level lose gender, literacy, health, disability, permanent effects of childhood malnutrition etc.
2. Time scale How much real time should a ‘tick’ represent? Above 1 week, lose sense of weekly provision/ shopping, progression of illness, deterioration in health, economy etc. How to model behaviour in weekly ‘chunks’? Eg. spatial movement?
3. Spatial Scale How much real space should a grid cell represent? Above 1 km lose sense of local village scale, distances to schools, health clinics etc.
Summary • Agent scale: individuals (‘super-consumers’) • Time scale: 1 ‘tick’ = 1 week • Spatial scale: 1 cell = 1 km2 • Commodity scale: 8 commodities • 5 & 6. Financial scales: cash only at this stage • Key idea: Combination of ‘representative region’ and 10,000 ‘super consumers’ (each representing ~ 177 people) to make model production & consumption volumes ~ 1/20th of national economy. • Hypothesis: Model’s demographic and growth effects translate to national effects; multiply volume effects by 20 to get national volumes.
Raster GIS Regional Map of Tanzania Raster torus 217 x 217 1 cell = 1 km2 Map = 47,089 km2 = ~ 1/20th area of Tanzania & ~ 1/20th impenetrable perimeter (borders, lake shores & coasts) Red = HHs Blue = Firms
Household bargaining power We define: • H = average household health level [1, 10] (10 is perfectly healthy) • E = average education of adults in the household [0, 17] (years) • M = household mobility [0, 10]; • I = household access to information [0, 10]; • BPH= component of bargaining power due to health • BPE = component of bargaining power due to education • BPM = component of bargaining power due to mobility • BPI = component of bargaining power due to access to information • BP= BPH + BPE +BPM + BPI • BP is scaled so that it has a range between 0 and 100.
Health & bargaining power Education & bargaining power
Tracking the evolution of bargaining power within household poverty bands
Evolution of Tanzanian population Evolution of population not based on an equation but on thousands of births, deaths (old age, sickness, infant mortality, maternal mortality), marriages, sicknesses & recoveries in both rural & urban areas. 8 years = 416 weekly ‘ticks’
Another recent ABM example … Lim, M., Metzler, R. and Bar-Yam, Y., (2007) "Global Pattern Formation and Ethnic/Cultural Violence", Science, Vol. 317, No. 5844, 14 September, pp. 1540-1544. Model predicts conflict zones extremely well based on spatial pattern of ethnic mixing.
For more information … • Leigh Tesfatsion’s website: http://www.econ.iastate.edu/tesfatsi/ace.htm • Netlogo (Excellent for beginners) http://ccl.northwestern.edu/netlogo/ • Repast (Java or C#) http://repast.sourceforge.net/