Interactive Introduction cost effectiveness
Interactive Introduction cost effectiveness. Jan J. v. Busschbach, Ph.D. Psychotherapeutic Centrum ‘De Viersprong’, Halsteren Jan.Busschbach@deviersprong.net +31 164 632200 Department of Medical Psychology and Psychotherapy, Erasmus MC j.vanbusschbach@erasmusmc.nl +31 10 4087812.

Interactive Introduction cost effectiveness
E N D
Presentation Transcript
Interactive Introduction cost effectiveness • Jan J. v. Busschbach, Ph.D. • Psychotherapeutic Centrum ‘De Viersprong’, Halsteren • Jan.Busschbach@deviersprong.net • +31 164 632200 • Department of Medical Psychology and Psychotherapy, Erasmus MC • j.vanbusschbach@erasmusmc.nl • +31 10 4087812
Time Without Symptoms of disease and subjective Toxic effects of treatment • TWiST • Developed by Gelber (statistician) • In search for a typical “cancer” problem • Often prolonged life but also a reductions in quality of life • At the beginning (side effects) • At the end • Only count the days without symptoms of disease and subjective toxic effects of the treatment
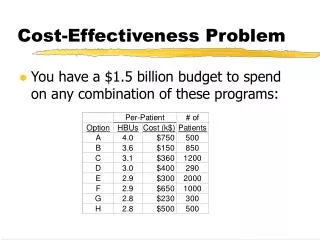
New cancer therapy (2) • 50 patients each year (per hospital) • Drug x: 50 x euro 1.750 = euro 87.500 • Drug y: 50 x euro 2.000 = euro 100.000 • Drug budget for x or y = euro 50.000 • Number of patient • Drug x: euro 50.000 / 1.750 = 28.5 patients • Drug y: euro 50.000 / 2.000 = 25.0 patients • Survival in days • Drug x: 28.5 patients x 300 days = 8.550 days • Drug y: 25.0 patients x 400 days = 10.000 days • Survival in TWiST • Drug x: 28.5 patients x 190 TWiST = 5.415 days • Drug y: 25.0 patients x 220 TWiST = 5.500 days
TWiST ignores differences in quality of life • TWiST • Healthy = 1 • Sick (dead) = 0 • There is more to life than sick/health • Make scale 0..1 • Quality of life scale • Quality adjusted TWiST • Q-TWiST • Almost equal to Quality Adjusted Life Years (QALYs) • How to scale quality of life?
EuroQol EQ-5D • MOBILITY • I have no problems in walking about • I have some problems in walking about • I am confined to bed • SELF-CARE • I have no problems with self-care • I have some problems washing or dressing myself • I am unable to wash or dress myself • USUAL ACTIVITIES (e.g. work, study, housework family or leisure activities) • I have no problems with performing my usual activities • I have some problems with performing my usual activities • I am unable to perform my usual activities • PAIN/DISCOMFORT • I have no pain or discomfort • I have moderate pain or discomfort • I have extreme pain or discomfort • ANXIETY/DEPRESSION • I am not anxious or depressed • I am moderately anxious or depressed • I am extremely anxious or depressed
Value a health state • Wheelchair • Some problems in walking about • Some problems washing or dressing • Some problems with performing usual activities • Some pain or discomfort • No psychosocial problems
Time Trade-Off • TTO • Wheelchair • With a life expectancy: 50 years • How many years would you trade-off for a cure? • Max. trade-off is 10 years • QALY(wheel) = QALY(healthy) • Y * V(wheel) = Y * V(healthy) • 50 V(wheel) = 40 * 1 • V(wheel) = .8
In health economics: Q-TWiST = QALY • Count life years • Value (V) quality of life (Q) • V(Q) = [0..1] • 1 = Healthy • 0 = Dead • One dimension • Adjusted life years (Y) for value quality of life • QALY = Y * V(Q) • Y: numbers of life years • Q: health state • V(Q): the value of health state Q • Also called “utility analysis”
Which health care program is the most cost-effective? • A new wheelchair for elderly • Increases quality of life = 0.1 • 10 years benefit • Extra costs: $ 3,000 per life year • QALY = Y x V(Q) = 10 x 0.1 = 1 QALY • Costs are 10 x $3,000 = $30,000 • Cost/QALY = 30,000/QALY • Special post natal care • Quality of life = 0.8 • 35 year • Costs are $250,000 • QALY = 35 x 0.8 = 28 QALY • Cost/QALY = 8,929/QALY
Car economics • Should we spend our money on a • Suzuki Alto 1.0 • BMW 316 • Comparing costs • Comparing outcome • Relate costs to outcome • Cost per outcome • Cost per kilometer • Suzuki Alto 1.0 • BMW 316
Egalitarian Concerns 1.0 Utility of Health 0.0 A B C
Implications shifting threshold • QALY are weighted • Weighted QALYs are maximized • Health is no longer the only thing maximized • Health status population will drop • Differences in health will drop • Egalitarian consideration are incorporated • Burden of disease becomes a criteria • Equity
Are health economic results used? • Must we be afraid of the uncontrolled use of QALY? • QALY league table are difficult to make • Largest at Harvard School of Public Health • www.hsph.harvard.edu/organizations/hcra/cuadatabase/intro.html • a comprehensive league table • a catalogue of preference scores • QALY league tables are not used • At least not in The Netherlands • There used to be a mysterious list in UK….
Health economic are used next to other criteria • Burden of disease • Ethical constrains • Financial constrains
Reimbursement arguments • Dunning’s Funnel • 1990 • Government declaration 2002 • Necessary care • Need • Equity elements • Efficacy • Cost effectiveness • Own account and responsibility
Reimbursement arguments Impact on QoL Effect on QoL Cost effectiveness ? QALYs