Download
1 / 31
330 likes | 615 Views
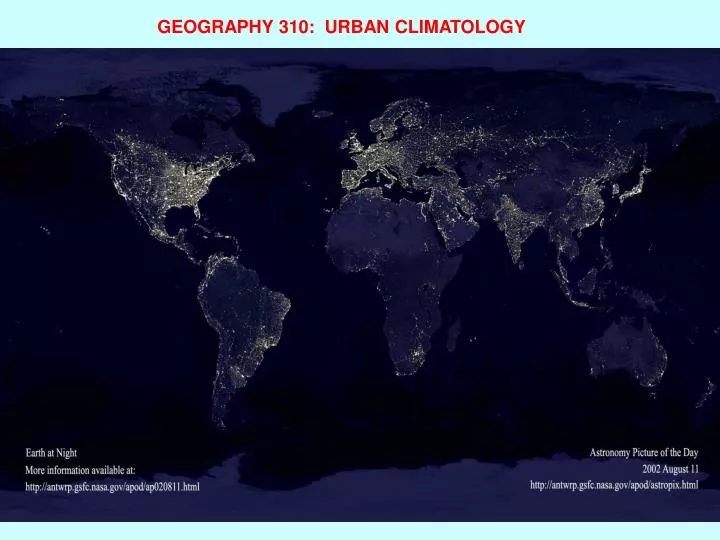
GEOGRAPHY 310: URBAN CLIMATOLOGY. THE EARTH SYSTEM ATMOSPHERE HYDROSPHERE CRYOSPHERE GEOSPHERE BIOSPHERE. THE CLIMATE SYSTEM. CLIMATE VERSUS WEATHER. Choose which one hurts less. Weather : The condition of the atmosphere at any given time and place.

E N D
THE EARTH SYSTEM ATMOSPHERE HYDROSPHERE CRYOSPHERE GEOSPHERE BIOSPHERE
CLIMATE VERSUS WEATHER Choose which one hurts less.
Weather: The condition of the atmosphere at any given time and place. • Climate: A description of average weather conditions. Often, it is defined by statistical weather information such as average temperature or average total precipitation.
Temporal Aspects of Climate: Climate Variability Climate Change
LA Civic Center (USC Campus) Annual Mean Temperature (1878-2007) Degrees F Year Data: NOAA NWS (Los Angeles/Oxnard) Bill Patzert/JPL
CA Warming Due To: • Land Use • Greenhouse Gas Warming California Temperature Changes (°F) 1950 - 2000 331 Met. Stations
“How inappropriate to call this planet Earth when it is quite clearly Ocean.” – Arthur C. Clarke
Very well. Give the heretic back his research funding. OK! I believe mankind causes global Warming!
Tide Gauge Observations 3.2 mm/year 2.0 mm/year ~ 8 inches (20 cm) 0.8 mm/year = 16,000 cubic miles!!! (67,000 cubic km) Average Rate ~ 1.8 mm/year [Church and White, 2006]
Sea Level Rise Malibu’s “sandbagged” Broad Beach. The once-wide sand strip, swept away by waves and rising seas.
To overturn the world economy based on the musings of a few idiot leftist scientists is just stupid, that’s what Global Warming is all about. -Rush Limbaugh-
Climate change • Climate is defined as the statistical properties of the atmospheric variables like temperature, precipitation, and wind. • So, climate change can be defined as any change in some statistical property like mean temperature.
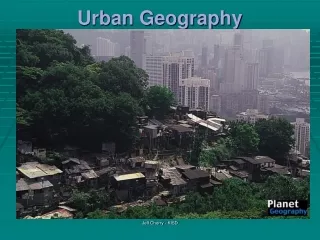
Human Transformation of the Land Surface The current land surface little resembles what existed 100,000 years or even 3,000 years ago • Fire for ecosystem management • Grazing • Deforestation metal smelting • Agriculture • Urbanization
Global Land Cover Urbanization Present Urbanization 43% of Land Area Dominated by Agriculture % of Land Area Built-up 3 - 6% World Population 6.5 Billion
Current U.S. Urban Growth Rate is ~12.5% • Nearly 50% of the World’s Land Surface has been transformed by human action • 80% of U.S. Population Lives in Urban areas • 60%-80% of World’s Population in urban areas by 2025
Can you find the Cities? Why do cities appear this way in this thermal satellite image?
Earth’s “Bio-Engine” Net Primary Production (NPP) NPP is the amount plant material produced on Earth. It is the primary fuel for Earth’s food web. Represents all available food and fiber. NPP can be measured in terms of Carbon (photosynthesis - CO2 exchange between atmosphere and biosphere (global climate change). Land use strongly impacts NPP Humans require almost 20% of Earth’s NPPcapacity on land NPP is the “Common Currency” for Climate Change, Ecological, & Economic Assessment.
Consequences of Urbanization on NPP-Carbon in the U.S. NPP Lost or Gained (annual) Due to Urbanization Going from a pre-urban to a post urban world • Urbanization and NPP • NPP decreased 41.5 M tons C / year. • Roughly equivalent to the increase • created by 300 years of agricultural • development. • How can this happen when urban areas occupy only 3% of the land surface and agriculture occupies 29%? • Location, Location, Location. • Urbanization is taking place on the most fertile lands • Reduction of NPP may have biological significance: Total Reduction 41.5 Mt C From Ag Lands 25.5 Mt C • Annual loss of food web energy 400 Trillion kilocalories (roughly equal to food energy requirement for 448 million people). • Reduction of actual food products equivalent to needs of 16.5 million persons annually (about 6% of US population). M. Imhoff/NASA