Download

1 / 29
290 likes | 379 Views
Learn about vaporization, condensation, boiling points, freezing points, and phase diagrams in chemistry. Explore the effects of temperature and pressure on different states of matter. Understand the concepts of vapor pressure, surface tension, and viscosity.

E N D
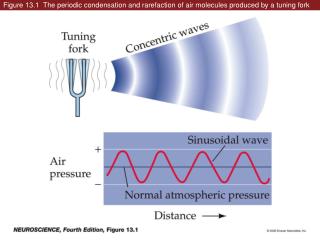
Figure 11.6: Rates of vaporization and condensation of a liquid over time.
Vapor Pressure • The vapor pressure of a liquid depends on its temperature. (see Figure 11.7) • As the temperature increases, the kinetic energy of the molecular motion becomes greater, and vapor pressure increases. • Liquids and solids with relatively high vapor pressures at normal temperatures are said to be volatile.
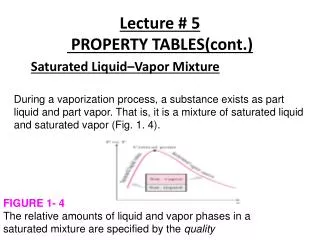
Boiling Point • The temperature at which the vapor pressure of a liquid equals the pressure exerted on the liquid is called the boiling point. • As the temperature of a liquid increases, the vapor pressure increases until it reaches atmospheric pressure. • At this point, stable bubbles of vapor form within the liquid. This is called boiling. • The normal boiling point is the boiling point at 1 atm.
Freezing Point • The temperature at which a pure liquid changes to a crystalline solid, or freezes, is called the freezing point. • The melting point is identical to the freezing point and is defined as the temperature at which a solid becomes a liquid. • Unlike boiling points, melting points are affected significantly by only large pressure changes.
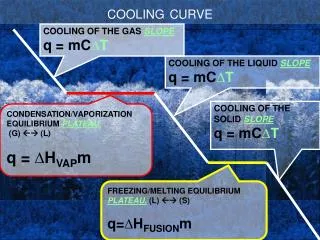
For ice, the heat of fusion is 6.01 kJ/mol. Heat of Phase Transition • To melt a pure substance at its melting point requires an extra boost of energy to overcome lattice energies. • The heat needed to melt 1 mol of a pure substance is called the heat of fusion and denoted DHfus.
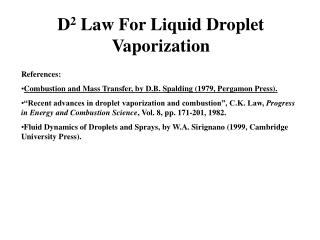
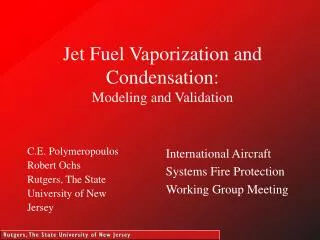
For ice, the heat of vaporization is 40.66 kJ/mol. Heat of Phase Transition • To boil a pure substance at its melting point requires an extra boost of energy to overcome intermolecular forces. • The heat needed to boil 1 mol of a pure substance is called the heat of vaporization and denoted DHvap. (see Figure 11.9)
A Problem to Consider • The heat of vaporization of ammonia is 23.4 kJ/mol. How much heat is required to vaporize 1.00 kg of ammonia? • First, we must determine the number of moles of ammonia in 1.00 kg (1000 g).
A Problem to Consider • The heat of vaporization of ammonia is 23.4 kJ/mol. How much heat is required to vaporize 1.00 kg of ammonia? • Then we can determine the heat required for vaporization.
Phase Diagrams • A phase diagram is a graphical way to summarize the conditions under which the different states of a substance are stable. • The diagram is divided into three areas representing each state of the substance. • The curves separating each area represent the boundaries of phase changes.
Phase Diagrams • Below is a typical phase diagram. It consists of three curves that divide the diagram into regions labeled “solid, liquid, and gas”. . B C solid liquid pressure . gas D A temperature
Phase Diagrams • Curve AB, dividing the solid region from the liquid region, represents the conditions under which the solid and liquid are in equilibrium. . B C solid liquid pressure . gas A D temperature
Phase Diagrams • Usually, the melting point is only slightly affected by pressure. For this reason, the melting point curve, AB, is nearly vertical. . B C solid liquid pressure . gas A D temperature
Phase Diagrams • Curve AC, which divides the liquid region from the gaseous region, represents the boiling points of the liquid for various pressures. . B C solid liquid pressure . gas A D temperature
Phase Diagrams • Curve AD, which divides the solid region from the gaseous region, represents the vapor pressures of the solid at various temperatures. . B C solid liquid pressure . gas A D temperature
Phase Diagrams • The curves intersect at A, the triple point, which is the temperature and pressure where three phases of a substance exist in equilibrium. . B C solid liquid pressure . gas A D temperature
Phase Diagrams • The temperature above which the liquid state of a substance no longer exists regardless of pressure is called the critical temperature. . B C solid liquid pressure . gas A D Tcrit temperature
Phase Diagrams • The vapor pressure at the critical temperature is called the critical pressure. Note that curve AC ends at the critical point, C. . B Pcrit C solid liquid (see Figure 11.13) pressure . gas A D Tcrit temperature
Figure 11.12: Phase diagrams for carbon dioxide and sulfur (not to scale).
Properties of Liquids; Surface Tension and Viscosity • The molecular structure of a substance defines the intermolecular forces holding it together. • Many physical properties of substances are attributed to their intermolecular forces. • These properties include vapor pressure and boiling point. • Two additional properties shown in Table 11.3 are surface tension and viscosity.
Figure 11.20:Comparison of the viscosities of two liquids.Photo courtesy of James Scherer.
Properties of Liquids; Surface Tension and Viscosity • Surface tension is the energy required to increase the surface area of a liquid by a unit amount. • This explains why falling raindrops are nearly spherical, minimizing surface area. • In comparisons of substances, as intermolecular forces between molecules increase, the apparent surface tension also increases.