Download
1 / 69
690 likes | 885 Views
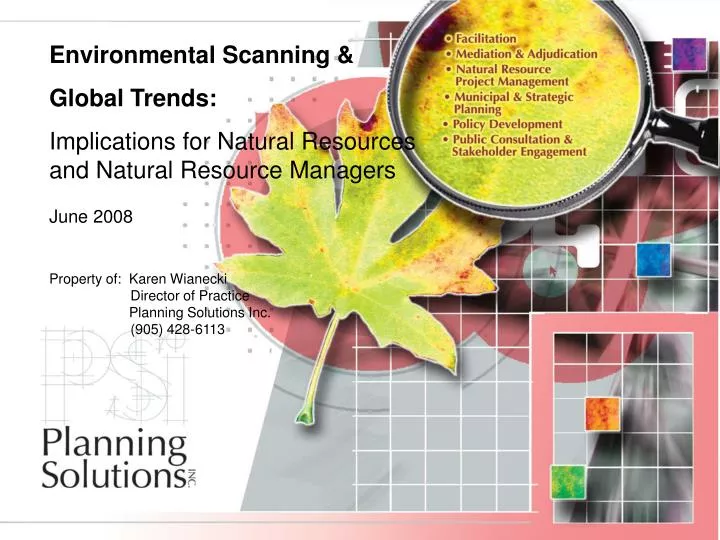
Environmental Scanning & Global Trends: Implications for Natural Resources and Natural Resource Managers June 2008 Property of: Karen Wianecki Director of Practice Planning Solutions Inc. (905) 428-6113. Why Is Scanning Important?.

E N D
Environmental Scanning & Global Trends: Implications for Natural Resources and Natural Resource Managers June 2008 Property of: Karen Wianecki Director of Practice Planning Solutions Inc. (905) 428-6113
Why Is Scanning Important? • Fast-paced information age • Focus on operational issues – crisis management • Old ways of doing business won’t allow us to keep pace • We need to move from reactive to proactive • Need to secure an ‘edge for the future’ – the future is a moving target • We need to know how the highly probable future will look – how can we influence the future today • Understanding driving forces of change allow us to act as catalysts for change
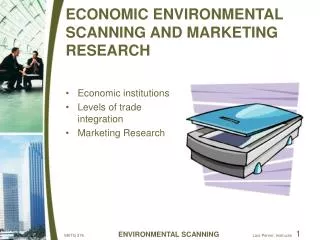
Environmental Scanning Global Trends & Drivers: • Demographic • Economic • Environmental • Socio-Cultural • Technological • Political
And the Credit Goes To… • Population Reference Bureau • Statistics Canada • U.S. Census • Canadian Economic Observer • Ministry of Finance Population Projections • Millennium Assessment Report • Dr. Richard Loreto (Demographics) • David Suzuki Foundation • National Energy Board • United Nations Environment Program • Academic Research
Demographic Trends & DriversThe Global Picture World population is growing by 80-85 million people per year • More births than deaths • Advancements in health science mean we are living longer • Population momentum = people of child-bearing age (50% of the world’s population is under age 25) • World population will increase 50% by 2050 – 9.264 billion people according to 2007 estimates • Most growth will occur in the developing nations – China and India • 88 countries have fertility rates lower than those required to replace their current populations • Japan will lose 26% of its population in the next 43 years • Germany, Russia will likely never recover from population decline • Italy and Eastern Europe (Bulgaria, Estonia, Latvia) also expected to witness marked decline
Percentage of Persons Age 65+ *Population Reference Bureau. 2007
Demographic Trends & DriversThe Global Picture • Population of the western world is aging • Population 65+ has increased 5-7% globally since 1950s (Europe & Japan lead the way; North America, New Zealand and Australia close behind) • Implications from mass spread of disease (e.g. AIDS pandemic will affect population growth and will produce age-sex distributions that have never been seen before - we live in a global environment - global drivers • China is becoming affluent; India is becoming electric - competition for other resources is going to increase
North American Demographics A Bird’s Eye View…
Generally Speaking… • U.S population will increase 39% from 302 million in 2007 to 420 million by 2050 • Canada’s population will increase from 32 million in 2007 to 41.6 million by 2050 – an increase of 26%
Our Southern Neighbour…What Do We Know About Population Distribution? Percentage Population Change 2005-2006 • U.S. is growing faster than Canada: Real growth is occurring in the dry, arid southwestern states
What Do We Know About the U.S. • 3.2 million/year are added to the U.S. population • By 2050, there will be 420 million people in the U.S. • Currently, 8 States have fertility rates over 2.0 – their populations will double in 35 years • Average U.S. fertility rate = 2.1335 (births/woman) – Highest Fertility Rate since 1971. • U.K. = 1.66 • Canada = 1.53 • Germany = 1.4 • Immigration adds 1 million people annually • Total foreign-born population in the U.S. = 31.1 million (this is a 50% increase since 1990)
What Else Do We Know About the U.S.? • Most of the population lives along the ecologically fragile coastline • U.S. is among the most densely populated countries in the world • N/E Seaboard – 767 people/square mile • Haiti – 314 people/square mile By 2010, California will have a population of 59 million – more than 1,050 people/sq. mile
U.S. Growing Bigger, Older, and More Diverse • Cultural shift is occurring in the U.S.: • Rates of natural increase are low; mortality rate is dropping; population is aging • Hispanic and Asian populations will triple from 2005-2050: • Hispanic population will increase from 36 to 103 million. (the Hispanic proportion of the population will more than double from 13% -24%.) • Asian population will also triple (11 million to 33 million). This will slightly more than double their population share from 5% to 9%.
Canadian Population Distribution Canada is the second largest country in the world in terms of land area (9 012 112.20 square kilometres), yet it ranks only 33rd in terms of population. Population less than 1000 Population greater than 1000 Source: Adapted from Statistics Canada, Population and Dwelling Counts, for Census Divisions, Census Subdivisions (Municipalities) and Designated Places, 2001 and 1996 Censuses - 100% data, Catalogue number 93F0050XDB01003.
Canadian Population Distribution • In 2006, 45% of all Canadians lived in one of 6 ‘Millionaire’ cities – Toronto, Montreal, Ottawa-Gatineau, Calgary & Edmonton • In 2007, over 68% of the nation's population, or about 21,599,000 lived in 33 census metropolitan areas (CMAs), up from 63% in 1996. • Seven of these 27 CMAs saw their populations grow at a rate of at least double the national average of 4%. The strongest rise, by far, occurred in Calgary, with Edmonton a close second.
Canadian Population Distribution • Population tends to concentrate in four urban regions: • The extended Golden Horseshoe in southern Ontario; • Montreal & surrounding areas; • British Columbia’s Lower Mainland; • Calgary-Edmonton corridor
Ontario Demographics • From 2001-2006, nearly half of Canada’s national growth occurred in Ontario. • January 1, 2008 = 12,861,940 population • Population growth was greatest in the 1980s and the early part of this decade. • Annual population growth averaged 1.7% (1997-2007) • In recent years, 4/5 of Ontario’s international immigrants have come from either Asia & Pacific or Africa and Middle East. • Regionally, the GTA accounted for 63% of Ontario’s growth (Peel, York, Halton, Durham, Simcoe) Northeast and Northwest experienced population decline. • MOFinance Projections: Robust Growth 2007-2031. Population will grow by 27.8% or 3.56 million over the next 24 years.
Ontario Demographics • From 2007 – 2031 Based on Spring 2008 Projections: • Net migration will account for 74% of total population growth • Median age of the Ontario population will increase to 43 years in 2031 from 39 years in 2007 • Population 65+ will more than double, increasing to 21.3% of total population • Population 75+ will more than double, increasing to 10% of the total population • GTA will be the fastest growing region – net migration is the key to this growth • Growth in the 905 area (Durham, Halton, Peel & York) are expecting growth rates ranging from 46-73% over next 25 years • Many areas surrounding the GTA are expected to experience above-average population growth • Growth in SW Ontario will be fastest in Essex County • In the GTA, 36% of the total population will be 50 years or older by 2026. • GTA will account for more than half of the total population of the Province • Northern Ontario population expected to continue to decline.
North American DemographicsWhat Conclusions Can We Draw? • Across N.A., Baby Boomer values will drive the agenda • Aging Population – Saskatchewan is the oldest province and the youngest • The fastest growing segment of the population are the ‘oldest old’ – those over 85 (population in the U.S. in particular will resemble Florida currently – 1 in 5 will be elderly) • Increasing urbanization but there are shifts in the areas of growth • First Nations offer the exception to the aging population – very young population base • In the U.S. net population change (births-deaths+net migration) will be greatest in Florida, California & Texas • In Canada, the growth is occurring in the Golden Horseshoe and west of Manitoba
Implications for Natural Resources & Natural Resource Managers • Shrinking labour pool – mobile workforce • More competition for highly trained and technically skilled workers • Changing recreational demands (e.g. demand for parks, nature trails, hunting & fishing opportunities) • Greater demands for social services will impact the budget of resource management agencies • Continued population growth and urbanization will place pressure on the land base from competing uses and users
Economic Trends & DriversThe Global Picture • National scene is still dominated by the state of the economy • Shifts in the global economy are emerging – globalization is a key driver • Global giants are emerging in China and India • While we are losing manufacturing jobs, China has added 1.5 million workers to its payroll (4-5% increase/year) • Real economic growth is in: information, services and knowledge
North American Economics A Bird’s Eye View…
North American Economy • Productivity growth 2000-2004: • In Canada - 0.9%/year • In U.S. - 3.5%/year • 1.8% growth/yr. Average in GDP (1974-2004) • U.S. Economic slowdown – recession? Recovery? • Has been confined to the housing market, auto sector and financial sectors • Rest of the country remained healthy – business/investment climate; aerospace industry; wireless communications, etc. • Financial crisis in the US (Mexican Peso Crisis in 95; Russian Debt Default in 98; California Energy Crisis in early 2000; Enron Bankruptcy & the bursting of the dot.com bubble; 9/11; Hurricane Katrina…)
Canadian Economy • Economy is buoyant because of its shear size • 1.4 trillion GDP produced by 17 million Canadian workers • Some Alarming Statistics… • Manufacturing Sector Job Losses: • 2006: 59,000 jobs lost • 2007: 132,000 manufacturing jobs lost • 2008: 55,000 more jobs lost in the fist 5 months • Canada is divided between booming resource economies of the west and a slumping manufacturing sector in the east
Ontario Economy • Ontario to qualify for equalization payments based on economic and revenue projections • Ontario’s economy is highly dependent on exports: • Vulnerable to exchange rates • Vulnerable to interest rate fluctuations • U.S. economic slowdown and high $ are hurting Ontario’s export industries • Soaring oil and commodity revenues in Western Provinces makes Ontario seem poor • TD predicts that the Provincial economic output/person will be 4% below the national average next year – Western Province’s will be 20% above
Implications for Natural Resources & Natural Resource Managers • Recognize that we influence and are in turn influenced by global factors • Changes affecting the resource base are influenced by many factors beyond our control
Environmental Trends & IndicatorsThe Global Picture • Marked distinction between the developed and developing world re: environmental values • Changing environmental and climatic conditions – ecosystems are still adapting to these changes • Concerns with ecosystem degradation and loss • Environmental ethics have become mainstream • Emerging environmental consciousness among industry • Growing concern that human health is connected to environmental health
U.N. Report – Millennium Ecosystem Assessment Report • Released March 2005 • Assesses the consequences of ecosystem change related to human well-being • Prepared by 2000 authors and reviewers; 1360 experts in 95 countries; 80-person independent Board of Review Editors • Called for by UN Secretary General in 2000 • Authorized by Government through 4 Conventions • Partnership between UN agencies, conventions, business, non-government organizations • www.millenniumassessment.org
Unprecedented Change: Ecosystems • From 1960-2000: • World population doubled • Global economy increased six-fold • Food production increased 2.5 times • Water use doubled • Wood harvests for pulp and paper tripled • Hydropower capacity doubled • Timber production increased by more than one half • Human impact in the last 50 years has produced more dramatic ecosystem change than at any other time in history • More land was converted to cropland in the 30 years after 1950 than in the 150 years between 1700 and 1850 • 20% of the world’s coral reefs were lost and 20% degraded in the last several decades • 35% of mangrove area has been lost in the last several decades • Amount of water in reservoirs quadrupled since 1960 • Withdrawals from rivers and lakes doubled since 1960
Increased Likelihood of Nonlinear Changes • Ecosystem changes are increasing the likelihood of nonlinear changes (accelerating, abrupt and potential irreversible) • emergence of disease • abrupt changes in water quality • creation of ‘dead zones’ in coastal waters • collapse of fisheries • shifts in regional climate
U.N. Report - Predictions • World Population – 8.1-9.6 billion (2050) & 6.8-10.5 billion (2100) • Per capita income – increase 2-4X leading to increased consumption • Land Use Change and expansion of agriculture – major driver of change • High nutrient levels in water – increasing problem in developing countries particularly • Climate change will increase (temperature, precipitation, vegetation, sea level, frequency of extreme weather events)
U.N. Report – Links to Human Well-Being • Issue of water supply will not be related to ‘water to drink’ it will focus on ‘water to grow food’ • By 2030, 47% of the world’s population will be living under severe water stress – Right now, over 1 billion people globally lack access to safe water • Demand for food crops projected to grow 70-85% by 2050 • Water withdrawals projected to increase in developing countries but to decline in OECD countries • Food security to remain out of reach for many • More diversified diets in poor countries • Anticipate further impairment of ecosystem services in: • Fisheries • Food production in drylands • Quality of fresh waters
Environmental Trends • Environmental Damage is a political hot button today… • May 2007: Statutory Liability for Damage to the Environment introduced (used to apply only to personal injury and/or property damage) • Now, operators who cause ecological damage will be financial liable for fixing the damage
North American Environmental Trends A Bird’s Eye View…
In the U.S., groundwater that provides 31% of water used in agriculture is being depleted 160% faster than its recharge rate Ogallala aquifer (under Nebraska, Oklahoma and Texas) expected to be unproductive in 40 years Source: Food, Land, Population and the U.S. Economy. David Pimental, Cornell Univesity & Mario Giampietro. Instituto of Nazionale della Nutrizione, Rome. North America – Water Issues
Canada – Water Issues 2001 Report: Canada vs the OECD (David Boyd) & David Suzuki Foundation: The Maple Leaf in the OECD. Water consumption • Canada ranks 28th out of 29 nations of the OECD in terms of per capita water consumption. Only Americans use more water than Canadians • Since 1980, overall water use in Canada has increased by 25.7%. This is five times higher than the overall OECD increase of 4.5%. In contrast, nine OECD nations were able to decrease their overall water use since 1980
Canada – Climate Change • Canada is 27th out of 29 OECD nations when greenhouse gas emissions are measured on a per capita basis • Canadian greenhouse gas emissions continue to rise, up by more than 13.5% since 1990, despite a series of government initiatives that have relied largely on education and voluntary measures to stabilize emissions at 1990 levels by the year 2000 (Source: Canada vs. the OECD: An Environmental Comparison, Eco-Research Chair of Environmental Law & Policy, University of Victoria, 2001)