Download
1 / 21
210 likes | 360 Views
Palomar Transient Factory Data Flow. Jason Surace IPAC/Caltech. Complicated Data Path.

E N D
Palomar Transient FactoryData Flow Jason Surace IPAC/Caltech
Complicated Data Path Data flows through multiple pipelines, creating a variety of science products tailored for different purposes. These pipelines operate on multiple timescales. What data you want depends in large part on what science you want to do. • Realtime Data Processing – image subtraction, transient and solar system object detection. • High Fidelity Daily Processing – nightly processing and recalibration for highest data quality images and source catalogs. • Ensemble Processing – periodic construction of coadded images, processing of catalogs to create high precision light curves. • Long-term Data Curation- storage of all raw data, processed data (images and extracted photometry), and an advanced data archive with data exploration tools, with public release.
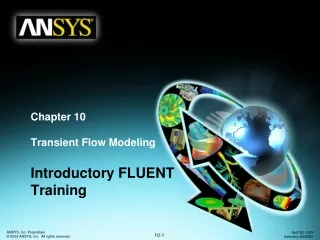
P48 NERSC Image Subtraction and Transient Detection/RB Pipeline Caltech/Cahill IPAC Realtime Image Subtraction Pipeline Transient Candidates Ingest Moving Object Pipeline SSOs Reference Images Epochal Images and Catalogs Photometric Pipeline Reference Catalogs Lightcurves Lightcurve Pipeline Reference Pipeline
Data Transfer • Data flows from the 48-inch and the PTF camera system via high-speed microwave link through a relay node at the San Diego Supercomputing Center to Cahill at Caltech. • From there it forks to two places: NERSC at LBNL and IPAC at Caltech. • Raw data moves as a multi-extension FITS file containing all 12 CCD images in an exposure, along with header metadata. This is the raw data product, and will not be used by many of you.
Raw Data Dead CCD 12 chips extracted from the MEF file and moaicked together.
NERSC Realtime Pipeline(see talk by Peter Nugent on day 1) • NERSC operates a realtime data pipeline which performs basic calibration, image subtraction against a reference image dataset, transient candidate detection, and candidate vetting via the RealBogus software. • This is the feed-in for the existing extragalactic transient marshall. • Designed around SNe detection. • Most of the SNe work you have seen has come from this pipeline. • In-collaboration dataset; currently transferring this functionality for the IPAC realtime pipeline, which will be the basis for future ZTF alerts.
IPAC Data Ingest You are here. • Data flows in realtime to IPAC. • Upon receipt, the MEF files are broken up into individual CCD files. PTF data system processes all the CCDs wholly independently. • Metadata about all the images goes into an operations database. • Data receive an initial WCS. • All the data are stored on spinning disk and in a deep tape archive. PTF data lives is here.
Infrared Processing and Analysis Center • Multi-mission Science Center (IRAS, ISO, Spitzer WISE, Herschel, Planck, 2MASS, etc) • Maintains several data rooms. • ~1TB of data every 4-5 days. • 24 drones with 240 cores. • Roughly 0.5 PB spinning disk. • Associated network equipment. • Database and file servers. • Archive servers. • Tape backup. • This will increase by a factor of 10x in the ZTF era! One shudders to imagine LSST, which will be measuring it’s computing power in megawatts. IPAC Morrisroe Computer Center
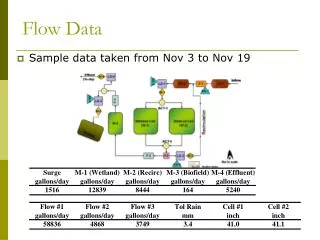
R-band Holdings 1275 nights, 3.1 million images
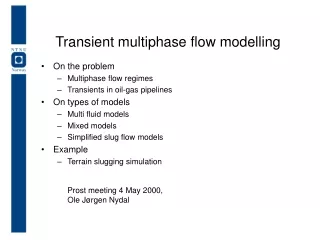
g-band Holdings 223 nights, 500 thousand images
H-alpha Holdings 99 nights, 125 thousand images
Realtime Pipeline(see talks by Adam Waszczak and Frank Masci) • Pipeline executes as data is received at IPAC. • Basic data reduction steps are cloned from the nightly photometric pipeline: bias correction and flat-fielding performed using stored calibration. Limited photometric calibration, but full astrometric calibration. • Image subtraction against a reference image library constructed from all the data to-date. In-house software. • “Streak detection” for fast-moving objects. • Transient candidate detection and extraction via psf-fitting and aperture extraction. • Image subtractions and candidate catalogs are pushed to an external gateway where they are picked up by the solar system, localization, and extragalactic marshalls. 10-50 minute phase lag. • Not yet publicly available, will be in the ZTF era.
Realtime Pipeline This is a fast streak candidate from the Solar System Marshall.
Photometric Pipeline(see talk by Russ Laher) • This pipeline processes data in the traditional manner. • Starts up at the end of the night, after all the data has been received. • Calibration is derived from the entire night’s worth of data. Specifically, the bias and flat-fields are derived from the data themselves. • Photometric calibration is derived from extracted photometry from all sources, fitting color, extinction, time and large-scale spatial variations vs. the SDSS. Typically reach an accuracy of a few %. See talk by Ofek, day 1. • Astrometric calibration is done individually at the CCD level, against a combined SDSS and UCAC4 catalog. Typically good to 0.15”. • Output from this pipeline are calibrated single-CCD FITS images and single-CCD catalog FITS binary tables (both aperture and psf-fit). These are archived through IRSA. Available 1-3 days after observation. • These are publicly available data products.
Photometric Pipeline Output Single R-band thumbnail image of Arp 220, 8 arcminutes across. Aperture extractions catalog (sextractor-based) overlaid. All observations and detections of everything are saved in the archive. Products are a reduced image, bit-encoded data quality mask, and catalogs. All products are FITS.
Reference Image Pipeline • Once enough individual observations accumulate, the “reference image” pipeline is triggered. • This pipeline coadds the existing data, after selecting “best frames”, e.g. best seeing, photometric conditions, astrometry, etc. • Coaddition is done based on CCD id, PTF tile, and filter. • These images are the reference of the static sky, at a level deeper than the individual observations. • “Reference Catalogs” are extracted from these images. • This concept is important, because these are both the underlying basis of the image subtractions,and also the basis of the light-curve pipeline. • Like PTF coverage, the depth of these is variable, but is current 5<n<50. • Resulting products are FITS images and FITS binary tables. • Will be publicly released 1 year from now.
Reference Images Single Image 60 sec @R Field 5257, Chip 7, Stack of 34
Deep Sky Coadds aka “Reference Images” * Results not typical. Near Galactic Center.
Light Curve Pipeline • Each night, all detected sources from the photometric pipeline are matched against the reference catalog (better than a generic catalog-matching approach). • All sources ever seen for a given CCD, PTF tile, and filter combination are loaded and analyzed. • Least variable sources used as anchors for the calibration. • Image-by-image correction factors computed for that image as a whole and stored as a lookup table. • Application of these secondary correction factors improves overall relative calibration to near-millimag levels for bright sources (that part is important). • Triggers less frequently (planned weekly updates). • Highest level of our products. This is an HD5 and LSD file hierarchy, currently not public. Will be in a couple years.
Example Light Curves Something a little different, these are relatively faint asteroid light curves from Chang et al. 2014.
Data Products What you can get today: calibrated epochal images and catalog files for select fields. In one year: epochal images and catalog files plus reference images and catalogs for all PTF data through 2012. In two years: all PTF data and rolling release of iPTF data including light curves. An additional talk this morning will be a demo of the data archive.