Download
1 / 11
110 likes | 143 Views
Learn how to make the most of your CRM records with Dynamics CRM Map integration. Plot multiple entities, manage records, and more.

E N D
How to Plot Entity Records on Map in Dynamics 365 The more scattered your data is, the harder it gets for you to understand and make any decisions. Moreover, to understand your current customer base as well as your opportunities and leads, it is imperative to have an overview of all your accounts, contacts, andleads. So, in this blog, we are going to show all the Dynamics CRM users out there how to plot Entity Records on a map right from theCRM. The Dynamics CRM itself provides this functionality of adding an Entity record on a map.
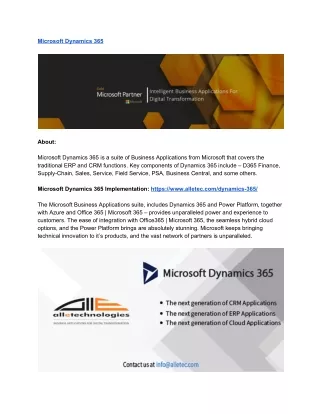
Step 1: Enabling BingMaps To enable Bing maps, go to the Settings → Administration →System Settings. By default, the General tab will open. Scroll down to the “Enable Bing Maps” option and select the “Yes” option to enable the BingMap. Press OK to save the changes. Step 2: Plotting entity records on themap After enabling Bing maps, go to any entity record and edit it. Find the ‘Form’ or ‘Form edit’ option. By clicking on it, the PowerApps tab will open. Select the Bing maps from the ‘Insert’ tab.
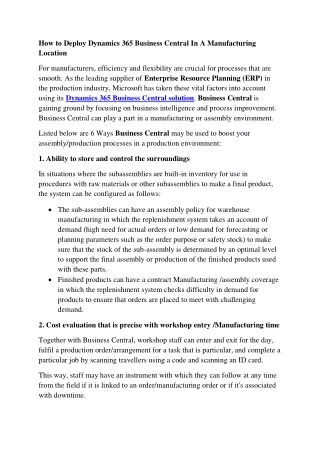
After clicking on Bing Maps, a pop-up will appear where you need to insert and select the required details. Save the changes and click onpublish. Now, you’ll be able to see the plotted account on the map inside of that account as shown in the belowimage.
With Dynamics default functionality, you cannot view multiple records on a map at the same time. You only get to see one record on themap. To see all your active accounts or all accounts or any other entity records on the map, you can opt for any Dynamics CRM Map integration from MS AppSource.
One such MicrosoftDynamics 365 mapIntegration is ‘Quick Maps’ using which you can display all the Dynamics CRM records on the map with the required details. • Other tasks that you can perform using Quick Mapsare: • You can plot and see the records of the selected entity geographically. • By selecting the multiple entities, you can save your own view (template) also. • To plot records of any entity like accounts, contacts, leads, etc., follow the belowsteps: • Step 1: Import the package of Quick Maps and installit. • Step 2: Navigate to “Quick Maps” from the appsmenu.
Step 3: Click on the sitemap and click on “EntityMappings”. Click on the “New” button to add and configure a newentity.
- Now, select an entity from the “Entity Name” dropdown and configure address fields for the selectedentity. • Create, Assign and Re-assign Sales Territories in DynamicsCRM • Check the checkbox “Automatically Geocode New Records” to automatically get geocodes when any new records for configured entity getcreated. • Click on the Save button to save entityconfigurations. • Step 4: Get geocode forrecords • To get geocode for records redirect to a particular entity. If you want to get geocode only for selected records, select those records and click on the “Get Geocode” button. • If you want to get geocode for all the records, click on the “Get Geocode” button. It will ask you a confirmation to get a geocode for all the records for the selectedentity.
Step 5: Plot records on themap - Navigate to AppJetty → Quick Maps → Maps to plot the records of the configuredentity.
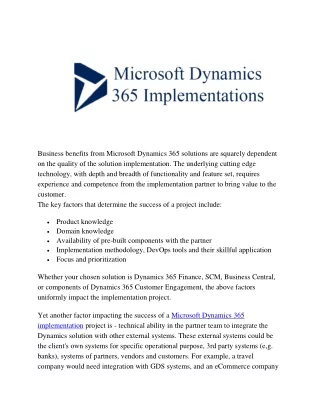
By clicking on Map, the Map view will be as per the default location configurations set by theadmin. • The side drawer menu with 4-tabs will appear on the left side of the map. By default, the Plot tab will beopen. • Under the Plot Records, select the Entity from the “Select Entity” drop-down to plot the records on themap. • Based on the selection of an Entity and other related options, the entity records will be displayed on themap. • If “Accounts” is selected, select its attribute which you want to plot on the map in the view options besides entity. Select “View” for Accounts like all accounts, my active accounts, inactive accounts,etc.
- The account details can be seen by clicking on a Pinicon. - Plotting the records for multiple entities is also possible in Quickmaps.
- Click on ‘+Add Legend’ text to add multiple entities. Select the entity and its detail which you want to plot on the map in the view options besidesentity. In this way, you can add and configure the entities to plot the CRM records on the map using Dynamics Map Integration, Quick Maps. You will get the geographical view of all the CRMrecords. Original Blog: https://www.appjetty.com/blog/how-to-plot-entity-records-map-dynamics-36 5