Network Properties and Motifs Analysis in Biological Networks
290 likes | 315 Views
Explore degree distribution, clustering coefficient, average diameter, and spectrum in biological networks. Understand network motifs reflecting evolutionary processes and functional information. Analyze graphlet degree distributions for network comparison.

Network Properties and Motifs Analysis in Biological Networks
E N D
Presentation Transcript
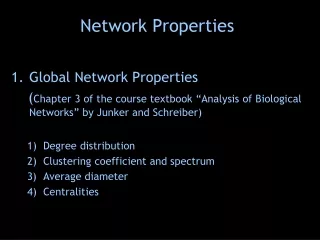
Network Properties • Global Network Properties (Chapter 3 of the course textbook “Analysis of Biological Networks” by Junker and Schreiber) • Degree distribution • Clustering coefficient and spectrum • Average diameter • Centralities
2) Clustering Coefficient and Spectrum • Cv – Clustering coefficient of node v • CA= 1/1 = 1 • CB = 1/3 = 0.33 • CC = 0 • CD = 2/10 = 0.2 • … • C = Avg. clust. coefficient of the whole network • = avg {Cv over all nodes v of G} • C(k) – Avg. clust. coefficient of all nodes • of degree k • E.g.: C(2) = (CA + CC)/2 = (1+0)/2 = 0.5 • => Clustering spectrum • E.g. • (not for G) G
3) Average Diameter u • Distance between a pair of nodes u and v: • Du,v = min {length of all paths between u and v} • = min {3,4,3,2} = 2 = dist(u,v) • Average diameter of the whole network: • D = avg {Du,v for all pairs of nodes {u,v} in G} • Spectrum of the shortest path lengths G v E.g. (not for G)
Network Properties 2. Local Network Properties (Chapter 5 of the course textbook “Analysis of Biological Networks” by Junker and Schreiber) • Network motifs • Graphlets: 2.1) Relative Graphlet Frequence Distance between 2 networks 2.2) Graphlet Degree Distribution Agreement between 2 networks
1) Network motifs (Uri Alon’s group, ’02-’04) • Small subgraphs that are overrepresented in a network when compared to randomized networks • Network motifs: • Reflect the underlying evolutionary processes that generated the network • Carry functional information • Define superfamilies of networks - Zi is statistical significance of subgraph i, SPi is a vector of numbers in 0-1 • But: • Functionally important but not statistically significant patterns could be missed • The choice of the appropriate null model is crucial, especially across “families”
1) Network motifs (Uri Alon’s group, ’02-’04) • Small subgraphs that are overrepresented in a network when compared to randomized networks • Network motifs: • Reflect the underlying evolutionary processes that generated the network • Carry functional information • Define superfamilies of networks - Zi is statistical significance of subgraph i, SPi is a vector of numbers in 0-1 • But: • Functionally important but not statistically significant patterns could be missed • The choice of the appropriate null model is crucial, especially across “families”
1) Network motifs (Uri Alon’s group, ’02-’04) • Small subgraphs that are overrepresented in a network when compared to randomized networks • Network motifs: • Reflect the underlying evolutionary processes that generated the network • Carry functional information • Define superfamilies of networks - Zi is statistical significance of subgraph i, SPi is a vector of numbers in 0-1 • Also – generation of random graphs is an issue: • Random graphs with the same degree in- & out- degree distribution as data constructed • But this might not be the best network null model
1) Network motifs (Uri Alon’s group, ’02-’04) http://www.weizmann.ac.il/mcb/UriAlon/
2) Graphlets (Przulj, ’04-’09) _____ • Different from network motifs: • Induced subgraphs • Of any frequency N. Przulj, D. G. Corneil, and I. Jurisica, “Modeling Interactome: Scale Free or Geometric?,” Bioinformatics, vol. 20, num. 18, pg. 3508-3515, 2004.
N. Przulj, D. G. Corneil, and I. Jurisica, “Modeling Interactome: Scale Free or Geometric?,” Bioinformatics, vol. 20, num. 18, pg. 3508-3515, 2004.
N. Przulj, D. G. Corneil, and I. Jurisica, “Modeling Interactome: Scale Free or Geometric?,” Bioinformatics, vol. 20, num. 18, pg. 3508-3515, 2004.
2.1) Relative Graphlet Frequency (RGF) distance between networks G and H: N. Przulj, D. G. Corneil, and I. Jurisica, “Modeling Interactome: Scale Free or Geometric?,” Bioinformatics, vol. 20, num. 18, pg. 3508-3515, 2004.
2.2) Graphlet Degree Distributions Generalize node degree
N. Przulj, “Biological Network Comparison Using Graphlet Degree Distribution,” ECCB, Bioinformatics, vol. 23, pg. e177-e183, 2007.
N. Przulj, “Biological Network Comparison Using Graphlet Degree Distribution,” ECCB, Bioinformatics, vol. 23, pg. e177-e183, 2007.
Network structure vs. biological function & disease Graphlet Degree (GD) vectors, or “node signatures” T. Milenkovic and N. Przulj, “Uncovering Biological Network Function via Graphlet Degree Signatures”, Cancer Informatics, vol. 4, pg. 257-273, 2008.
Similarity measure between “node signature” vectors T. Milenkovic and N. Przulj, “Uncovering Biological Network Function via Graphlet Degree Signatures”, Cancer Informatics, vol. 4, pg. 257-273, 2008.
Signature Similarity Measure between nodes u and v T. Milenkovic and N. Przulj, “Uncovering Biological Network Function via Graphlet Degree Signatures”, Cancer Informatics, vol. 4, pg. 257-273, 2008.
Later we will see how to use this and other techniques to link network structure with biological function.
Generalize Degree Distribution of a network • The degree distribution measures: • the number of nodes “touching” k edges for each value of k. N. Przulj, “Biological Network Comparison Using Graphlet Degree Distribution,” Bioinformatics, vol. 23, pg. e177-e183, 2007.
N. Przulj, “Biological Network Comparison Using Graphlet Degree Distribution,” Bioinformatics, vol. 23, pg. e177-e183, 2007.
N. Przulj, “Biological Network Comparison Using Graphlet Degree Distribution,” Bioinformatics, vol. 23, pg. e177-e183, 2007.
/ sqrt(2) ( to make it between 0 and 1) This is called Graphlet Degree Distribution (GDD) Agreement netween networks G and H.
Software that implements many of these network properties and compares networks with respect to them: GraphCrunch http://www.ics.uci.edu/~bio-nets/graphcrunch/
Network models • Geometric Gene Duplication and Mutation Networks • Intuitive “geometricity” of PPI networks: • Genes exist in some bio-chemical space • Gene duplications and mutations • Natural selection = “evolutionary optimization” N. Przulj, O. Kuchaiev, A. Stevanovic, and W. Hayes “Geometric Evolutionary Dynamics of Protein Interaction Network”, Pacific Symposium on Biocomputing (PSB’10), Hawaii, 2010.
Network models Stickiness-index-based model (“STICKY”) N. Przulj and D. Higham “Modelling protein-protein interaction networks via a stickiness indes”, Journal of the Royal Society Interface 3, pp. 711-716, 2006.