Download

1 / 27
270 likes | 416 Views
Costs and Outcomes of AIDS Treatment Delivery Models. Sydney Rosen ab , Lawrence Long b , Ian Sanne bc a Center for International Health and Development, Boston University, Boston, MA USA b Health Economics Research Office, Wits Health Consortium, Johannesburg, South Africa

E N D
Costs and Outcomes of AIDS Treatment Delivery Models Sydney Rosen ab, Lawrence Long b, Ian Sanne bc aCenter for International Health and Development, Boston University, Boston, MA USA bHealth Economics Research Office, Wits Health Consortium, Johannesburg, South Africa cClinical HIV Research Unit, University of the Witwatersrand, Johannesburg, South Africa February 2008
Rationale For This Study • Despite rapid expansion of national antiretroviral treatment (ART) programs, little is known about the economics of providing ART in Africa. • Most available cost estimates are based on pre-rollout experience, atypical providers, and/or clinical trials. • Most cost-effectiveness analyses compare treatment to no-treatment scenarios or model different drug or monitoring regimens. Delivery models and settings are usually not considered. • Better information is needed about the costs and outcomes of treatment under different delivery models and in different settings. • Here we present: • Methodology for estimating cost/outcome ratios using routinely collected data • Results using this methodology at four sites in South Africa.
Objectives • For various models of treatment delivery, as represented by specific study sites, estimate the average cost: • Per patient initiated on ART. • To produce a patient who is in care and responding to therapy after 12 months (or 24, or 36...) • Identify the main drivers of ART costs and differences between sites. • Explore the relationship between outcomes and costs. (Does investing more resources by the provider produce better outcomes, or is it all about the patients?) • Develop an easily understandable and implementable methodology for analyzing and presenting differences in the outcomes and costs of different ART delivery models.
Overview • Cost-outcome analysis (not standard cost-effectiveness analysis). • Medical record review only—no contact with patients required. • Cost estimates include all resources used by provider. (Not limited to resources paid for by site or cost to funder or donor.) • Steps: • Select sites representing common or promising models of treatment delivery. • Select a representative sample of ART patients from each site. • Calculate the cost of all resources used to treat each subject for the 12 months following ART initiation. • Determine each study subject’s outcome 12 months after ART initiation. • Estimate the average cost per patient treated and per outcome achieved.
Site Selection and Study Population • Site selection criteria • >100 adult patients initiated on ART more than 12 months before analysis. • Patient records computerized or well maintained hard copy files. • Agreement with the site and relevant authorities. • Sample selection criteria • >18 years old. • Initiated ART at site. • Did not transfer to another treatment site in the first 12 months. • Enrol a random or representative sample of eligible patients at each site.
Data Collection • Medical record review for patients in sample: • Patient characteristics (as available) • Baseline health data (t = 0) • Resource usage data (t = 0 …12) • Outcome health data (t = 12). • Unit cost estimates: • Obtain from site management and site records • Variable costs (drugs, labs, and clinicians’ time) • Fixed costs (infrastructure, utilities, equipment, administrative staff, etc.).
Data Analysis: Outcomes • Outcomes are assessed 12 months + / - 2 months (i.e. 10-14 months) after date of starting ARVs. • All outcomes are based on patient status at the initiating clinic. • Patients are excluded from the sample if they: • are known to have transferred to another site within 12 months of starting ART. • were eligible for treatment but were never dispensed any ARVs.
Data Analysis: Outcomes (Cont.) • NIC: “No longer in care at study clinic” • Died (with confirmation in file); or • No longer attending initiating clinic (missing a doctor’s visit or medication pickup > 3 months, reason unknown). • NR: “In care but not responding” • Condition: WHO Stage III or IV condition at last visit; or • Viral load: detectable (>400 copies); or • If no viral load done, CD4 change: < 50 cells increase. • IC: “In care and responding” • Viral load: undetectable (<400 copies); or • If no viral load done, CD4 change: > 50 cells increase; or • If no viral load or CD4 done, no current WHO Stage III or IV condition at last visit.
Decision point 12 months after ART initiation Patient outcome Indicator at 12 month point Subject still attending study clinic at end of month 12? No No longer in care Died No longer in care Stopped attending Yes Current WHO Stage III or IV condition at last visit Yes In care but not responding No In care and responding Undetectable Viral load reported in 12 +/- 2 months of starting point? Yes In care but not responding Detectable No In care and responding Increase ≥ 50 CD4 count reported in 12 +/- 2 months of starting point? Yes In care but not responding Increase < 50 No No WHO Stage III or IV condition at last visit Yes In care and responding Data Analysis: Outcomes (Cont.)
Data Analysis: Costs • For patients remaining in care for the full year, include all fixed and variable costs for full 12 months following treatment initiation. • For patients no longer in care, include all variable costs; pro-rate fixed costs until death or final visit. • Estimate costs at prices for a specified year (e.g. 2007).
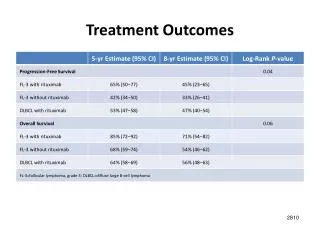
Average Cost Per Outcome, Months 0-12 All costs are in 2006 USD (R6.8=$1). *Difference from Site 1 significant at 5% level.
In care and responding In care but not responding No longer in care Distribution of Cost Per Patient Treated (Site 1)
Resource Utilization Resource utilization per patient treated (12 months following ART initiation)
Preliminary Conclusions • It is possible to generate useful information from routinely collected data using simple methods. • Outcomes and costs of ART differ by site and presumably by model; magnitude of differences varies. • Cost-effectiveness of ART can be sabotaged by high costs, high patient attrition, or both. • Patient characteristics are probably an important determinant of outcomes. • Treatment facility scale is likely an important determinant of costs. • Once outcomes are considered, perceptions of resource investments and needs may change (e.g., greater investment in retaining patients in care would likely be cost effective, though more expensive).
Limitations of These Findings • Only 4 sites completed so far; generalizability limited. • Sample size at each site is too small for stratification. • Estimates are of average, not marginal, costs. • Does not take patient differences into account. • Excludes some potentially important costs: • Inpatient care • Care provided by other facilities (e.g. for TB) • Costs to patients themselves • Treatment programme management above the level of the individual facility or project.
Ongoing Study • Analyzing new sites in South Africa representing other models of treatment delivery (e.g. nurse-driven, primary health clinic-based, etc.). • Extending the analysis to 24+ months after ART initiation. • Expanding the analysis to pediatric treatment delivery models. • Implementing the same evaluation in Kenya and Zambia.
Acknowledgements • Participating clinics and their medical directors, staff, and patients • Gauteng Department of Health • Right to Care • USAID (South Africa Mission and HIDN/HaRP) • PEPFAR • Colleagues at Boston University and the University of the Witwatersrand