Download
1 / 57
570 likes | 592 Views
Explore the latest advancements in using the Dilatometer Test (DMT) for designing laterally loaded piles, multi-anchored diaphragm walls, and more in geotechnical engineering. Gain insights on deriving P-y curves, soil moduli estimation, and practical applications. Discover validated methodologies and correlations enhancing design accuracy.

E N D
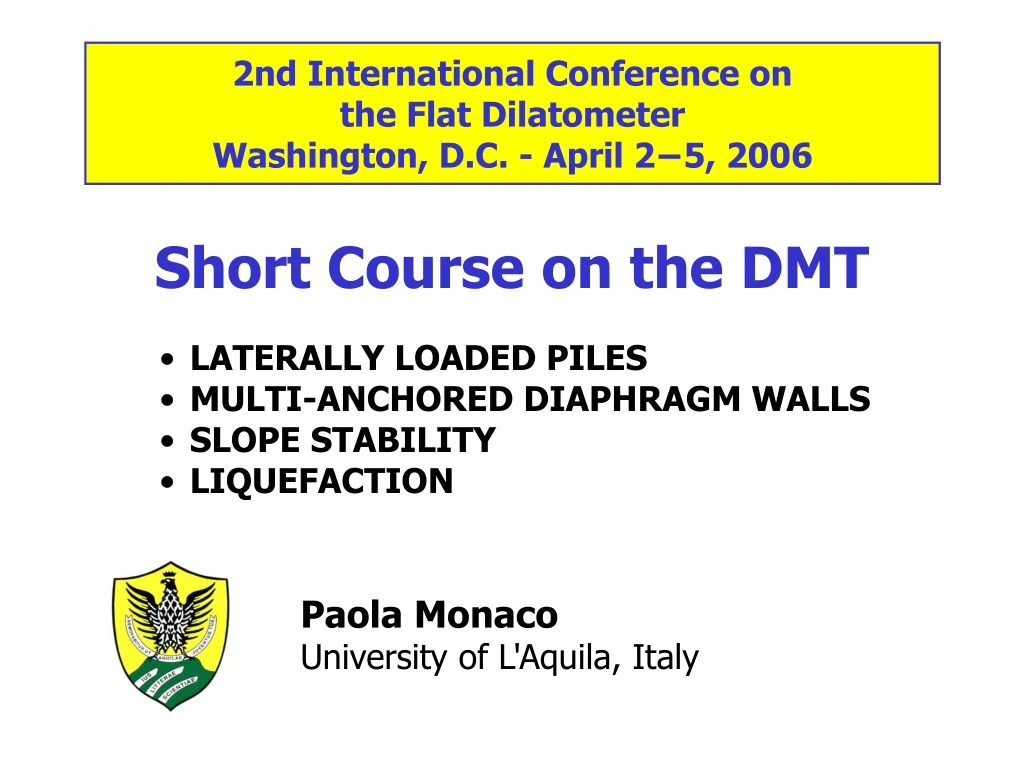
2nd International Conference on the Flat Dilatometer Washington, D.C. - April 2–5, 2006 Short Course on the DMT LATERALLY LOADED PILES MULTI-ANCHORED DIAPHRAGM WALLS SLOPE STABILITY LIQUEFACTION Paola Monaco University of L'Aquila, Italy
DMT for DESIGN of LATERALLY LOADED PILES
Background Original stimulus for development of DMT tool for parameters for DESIGN of LATERALLY LOADED PILES Similarity DMT – LL PILES • Structural element installed in soil • LATERAL deformation MARCHETTI (1977) - "Devices for In Situ Determination of Soil Modulus Es" Proc. 9th ICSMFE, Tokyo, Spec. Session No. 10.
Recommended methods for P-y curves from DMT ROBERTSON et al. (1987) - clays and sands • Adaptation of early P-y curve methods (Skempton 50 - Matlock 1970 cubic parabola approach) with "lab soil properties" inferred from DMT MARCHETTI et al. (1991) - clays • Straightforward procedure deriving P-y curves DIRECTLY from DMT - bypassing tortuous step of estimating "lab soil properties" by DMT Both for SINGLE PILE & 1st time monotonic loading ROBERTSON et al. (1987) - "Design of Laterally Loaded Driven Piles Using the Flat Dilatometer". Geot. Testing Jnl, No. 1. MARCHETTI et al. (1991) - "P-y curves from DMT data for piles driven in clay". Proc. 4th Int. DFI Conf. Piling and Deep Foundations, Stresa, Vol. 1.
Method by Marchetti et al. (1991) Pu Esi P-y CURVE at given depth Pu = f(p0-u0) shear strength Esi = f(ED) stiffness Pu = K1(p0 - u0 )D ultimate lateral soil resistance Esi = K2 ED initial tangent "soil modulus" reduction factor for z<7D (=1 for z=7D) K1 = 1.24empirical soil resistance coefficient K2 = 10(D/0.5m)0.5 empirical soil stiffness coefficient
Validations on full scale piles Mortaiolo (Italy) NC soft clay Marchetti et al. (1991) + NGI (1998), Georgia Tech (1998) 2 methods similar predictions Very good agreement PREDICTED vs OBSERVED behavior
Laterally loaded pile groups Ruesta & Townsend (1997) P-y curves derived from DMT/PMT, based on large-scale load test on 16 pile group RUESTA & TOWNSEND (1997) - "Evaluation of Laterally Loaded Pile Group at Roosvelt Bridge". Jnl ASCE GGE, 123, 12.
DMT for DESIGN of MULTI-ANCHORED DIAPHRAGM WALLS
Background Multi-anchored diaphragm walls widely used today for retaining deep open pit excavations (e.g. car parkings), often in combination with top-down construction "SPRING" calculations (Subgrade Reaction Method SRM) still currently used in design practice CRUCIAL STEP selection of coefficient of subgrade reaction Kh – depends on soil modulus + "geometrical-mechanical" factors ??? Yet engineers familiar with moduli, not with Kh Useful even crude RELATIONS M to Kh
Existing Kh formulations for diaphragm walls • Existing formulations for Kh (Balay 1984, Becci & Nova 1987 etc.) generally KhE/B with B = "characteristic dimension" width of soil zone "loaded" by diaphragm wall • Indications for B generally for cantilever walls (e.g. B free height or embedded depth) • For multi-restrained walls estimate of B >> uncertain (earth pressure K0 , displacements limited by restraints)
Tentative correlation Kh–MDMT Monaco & Marchetti (2004) - ISC'2 Porto • FEM analysis (PLAXIS) with input soil moduli estimated from MDMT – various cases of wall/soil stiffness, excavation depth and prop spacing • SPRING analysis varying Kh until bending moments and horizontal displacements of wall values calculated by FEM • Tentative correlation between "best fit" Kh (best match of FEM results) and MDMT Kh calibrated vs FEM = assumed as "REALITY" NUMERICAL study (no comparisons predicted/ observed behavior in real cases) – needs validation
Selection of Plaxis input moduli based on DMT moduli Hardening Soil Model 3 moduli at pref = 100 kPa: • 1-D tangent modulus Eoedref • Triaxial modulus E50ref • Unloading-reloading modulus Eurref Eoed = Eoedref ('1/pref ) m E50 = E50ref ('3/pref ) m m 0.5-1 Eur = Eurref ('3 /pref ) m
Schanz & Vermeer (1997) Literature survey for very loose to very dense quartz sands: E50ref = 15 to 75 MPa MDMT for sands of similar densities E50ref correlated to Eoedref E50 triax can be estimated from Eoed All moduli required by HS Model estimated from MDMT ("operative") Eoed = MDMT E50ref = Eoedref Eurref = 4 Eoedref(Vermeer 2001)
Input soil data – HS Model = 19 kN/m3 ' = 30° c' = 0.5 kPa = 0 = 20° (wall/soil) K0 = 0.5 Eoedref = MDMT at pref = 100 kPa SOFT SOIL Eoedref = 4 MPa MEDIUM SOIL Eoedref = 16 MPa STIFF SOIL Eoedref = 40 MPa E50ref =Eoedref Eurref =4Eoedref m = 0.5 ur = 0.2 3 soils differ only for STIFFNESS For all soils E50 /Eoed /Eur = 1/1/4 All other parameters equal Drained conditions (u = 0 everywhere) Wall "wished in place"
Input diaphragm wall data g.l. H s L H= 12-18-24 m s = 3-6 m L = 6 m Rigid wall EI = 2083 MNm2/m (1 m thick concrete wall) Flexible wall EI = 232 MNm2/m (steel sheetpile wall) Top-down excavation • Prop installation • Excavation down to next prop • Prop installation ...
Comparison FEM vs SRM EARTH PRESSURE DISPLACEMENT BENDING MOMENT DEPTH Example of results for soft soil/flexible wall, excavation depth H = 18 m, prop spacing s = 3 m
"Best fit" Kh vs excavation depth Kh (kN/m3) Excavation depth H (m) MDMT=5-7MPa MDMT=20-30MPa MDMT=50-70MPa 1 m thick concrete diaphragm wall s=3m s=6m
Tentative correlation Kh–MDMT Khdecreases when WALL DEFORMATIONS increase due to >> EXCAVATION DEPTH or << RESTRAINT DEGREE Hence increase in B = width of soil zone involved by wall movements "characteristic length" Kh = MDMT/B (similar to existing formulations for Kh ) Broad indication for selecting design values of B – hence Kh – for multi-propped diaphragm walls in cases of similar wall geometry/stiffness and prop spacing for various ranges of MDMT
B values in the formula Kh=MDMT/B 1 m thick concrete diaphragm wall B (m) s = prop spacing s=6m s=3m MDMT=5-7MPa Excavation depth H (m)
B values in the formula Kh=MDMT/B 1 m thick concrete diaphragm wall B (m) s=6m s=3m s = prop spacing MDMT=20-30MPa Excavation depth H (m)
B values in the formula Kh=MDMT/B s=6m 1 m thick concrete diaphragm wall B (m) s=3m s = prop spacing MDMT=50-70MPa Excavation depth H (m)
DMT for EVALUATING STABILITY of a SLOPE
Verify if an OC clay slope contains ACTIVE (or old QUIESCENT) SLIP SURFACES
DMT-KD method for detecting slip surfaces in OC clay slopes Identifying zones of NC clay in a slope which, otherwise, exhibits an OC profile, using KD 2 as identifier of NC zones Specific value KD =2 (not simply "weak zones") Detects even quiescent slip surfaces which could reactivate (inclinometers cannot – must move) But cannot establish if slope is presently moving and how fast (inclinometers can) In many cases DMT + inclinometers helpfully used in combination (e.g. use KD profiles to optimize location/depth of inclinometers)
Examples of KD 2 in slip surfaces LANDSLIDE "FILIPPONE" (Chieti) DOCUMENTED SLIP SURFACE LANDSLIDE "CAVE VECCHIE" (S. Barbara) DOCUMENTED SLIP SURFACE
Todi Hill landslide (Italy) Qualitative reconstruction (Tonnetti 1978) KD 2 layers correspond to SLIP SURFACES by INCLINOMETERS
Chieti Hill (Italy) DMT tests Central part "infected" by KD 2 layers = past/present shear planes sound clay sound clay Problem: SAFETY of very heavy NEW BUILDING to be constructed on an OC CLAY SLOPE Slope stable ??? Attacked by verifying via KD presence of previous slip surfaces
Solution: MODIFY original PROJECT to increase safety of building
LEROUEIL (2001) - Rankine Lecture Géothecnique 51(3), 197-243
DMT for EVALUATING SAND LIQUEFIABILITY
Background Many of factors making DMT + sensitive to compaction and + accurate for settlements (Stress History ...) are known to affect "liquefiability" Correlations CRR-KD have been developed in last two decades, stimulated by recognized sensitivity of KD to factors known to increase liquefaction resistance – stress state/history ... Reference approach simplified procedure (Seed & Idriss 1971)
Simplified procedure (Seed & Idriss 1971) LIQUEFACTION if seismic stress CSR liquefaction resistance of soil CRR CSR = av/'vo = 0.65(amax/g)(vo/'vo)rd CRR from CPT, SPT, VS … (case histories) Youd & Idriss (2001) – ASCE Jnl GGE 127(4) Liquefaction Resistance of Soils: Summary Report from the 1996 NCEER and 1998 NCEER/NSF Workshops on Evaluation of Liquefaction Resistance of Soils
Recommended CRR curves for CPT-SPT CPT Clean Sand Base Curve CSR or CRR CSR or CRR SPT Clean Sand Base Curve Corrected CPT Tip Resistance qc1N qc1N=(pa/'vo)n(qc/pa) Youd & Idriss (2001) Summary Report 1996 & 1998 NCEER Workshops – ASCE Jnl GGE 127(4) Corrected SPT Blow Count (N1)60 (N1)60=NmCNCECBCRCS
Recommended CRR-VS curves CSR or CRR Andrus & Stokoe (2000) Andrus et al. (2004) Stress-Corrected Shear Wave Velocity VS1 (m/s) VS1 = VS (pa/'vo)0.25
Evaluation of CRR from Lab/CC Major obstacle is obtaining UNDISTURBED samples, unless by non-routine sampling techniques (e.g. ground freezing) Adequacy of using RECONSTITUTED sand specimens – even "exactly" at the same "in situ density" – is questionable (in situ fabric/cementation/aging affect significantly CRR)
Importance of evaluating CRR by more than one method Robertson & Wride (1998) CRR by CPT (preferred to SPT, due to its poor repeatability) adequate for low-risk small-scale projects, for medium- to high-risk projects recommended to estimate CRR by more than one method NCEER Workshops (Youd & Idriss 2001) if possible two or more tests should be used for a more reliable evaluation of CRR Idriss & Boulanger (2004) often synthesis of findings from several different procedures provides most insight ... using a number of in situ testing methods should continue to be the basis for standard practice, and the allure of relying on a single approach (e.g. CPT-only) should be avoided
Basis of the correlation CRR-KD KD=(po-uo)/'vo Horizontal Stress Index Research has shown KDreactive to factors increasing CRR: in situ stress state, stress-strain history, structure, cementation, aging … KDindex parameter of liquefaction resistance Impossible to isolate each contribution, however a low KD signals none of above factors is high, i.e. sand is loose, uncemented, in a low K0 environment and has little stress history under these conditions may liquefy or develop large strains under cyclic loading
Basis of the correlation CRR-KD • Confirmation from recent studies: - Sensitivity of KDin monitoringdensification - Sensitivity of KD to prestraining - Correlation KD-Relative Density - Correlation KD-in situ State Parameter
Sensitivity of DMT in monitoring soil densification High sensitivity of DMT in monitoring DENSIFICATION, demonstrated by several studies, suggests DMT may also sense SAND LIQUEFIABILITY A liquefiable sand may be regarded as a sort of "negatively compacted" sand Plausible that DMT sensitivity holds both in positive and negative range
Sensitivity of KD to prestraining CC TEST N.216 IN TICINO SAND (prestraining cycles) Jamiolkowski & Lo Presti ISC'98 Atlanta KD+20% qD +3% Increase in KD caused by prestraining found 3 to 7 times increase in penetration resistance qD
Importance of stress-strain history Jamiolkowski et al. (1985) reliable predictions of liquefaction resistance of sand deposits of complex stress-strain history require development of some new in situ device (other than CPT or SPT),more sensitive to effects of past stress-strain histories
Correlation KD-DR(NC uncemented sands) KD Relative Density DR (%) Reyna & Chameau (1991) Additional KD-DRdatapointsobtained byTanaka & Tanaka (1998) on high quality frozen samples
Example of "KD crusts" in sands - Catania "Crust-like" KD profiles – very similar to typical KD profiles in OC desiccation crusts in clay – found at top of most sand deposits investigated by DMT KD profile generally reflects OCR in sand – often result of complex history of preloading / desiccation / other effects Shallow KD crusts may be also due (in part) to dilatancy In shallow KD crusts in most sandy sites KD >> 6-7 (giving DR =100% by Reyna & Chameau KD-DR correlation for NC uncemented sands) part of KD due to overconsolidation or cementation, rather than to DR
Example of "KD crusts" in sands - Catania MATERIAL INDEX CONSTRAINED MODULUS UNDRAINED SHEAR STRENGTH HORIZONTAL STRESS INDEX SHEAR WAVE VELOCITY CLAY SILT SAND
Importance of OCR/aging Pyke (2003) (Discussion to Youd et al. 2001, ASCE Jnl GGE) • Seed (1979) listed various factors assumed to have similar effect on penetration resistance and liquefaction potential, but these were never intended to be equalities • Two of these factors – overconsolidation and aging – likely to have much greater effect on increasing liquefaction resistance than penetration resistance • Soils even lightly OC or more than several decades old may have greater resistance to liquefaction than indicated by current correlations, which are heavily weighted by data from hydraulic fills and very recent streambed deposits
CRR from State Parameter SP important step forward in characterizing soil behavior, combining effects of both DR and stress level in a rational way SP (vertical distance between current state and critical state line in e-ln p' plot) governs tendency of a sand to increase or decrease in volume when sheared, hence it is strongly related to liquefaction resistance More rational methods for evaluating CRR would make use of SP (e.g. Boulanger 2003, Boulanger & Idriss 2003) Recent research supports KD as an index reflecting SP
Correlation KD–State Parameter KD/K0 In situ state parameter 0 Yu (2004) – Mitchell Lecture, ISC'2 Porto
Physical meaning of KD Reaction of soil against penetrating blade could be seen as indicator of soil reluctance to volume reduction A loose collapsible soil will not strongly contrast a volume reduction and will oppose a low 'h (hence a low KD) to blade insertion Moreover such reluctance is determined at existing ambient stressesincreasing with depth (apart alteration of stress pattern close to blade) At least intuitively, a connection is expectable between KD and SP
Previous CRR-KD curves 0.5 0.4 0.3 0.2 0.1 0 0 2 4 6 8 10 M=7.5 Reyna & Chameau 1991 CSR or CRR LIQUEFACTION Marchetti 1982 Robertson & Campanella 1986 NO LIQUEFACTION KD
New tentative CRR-KD curve Monaco et al. (2005) new tentative correlation for evaluating CRR from KD– to be used according to the Seed & Idriss (1971) "simplified procedure" New correlation combines previous CRR-KD curves + "experience" incorporated in current methods based on CPT-SPT, translated using DR as intermediate parameter