Download
1 / 28
280 likes | 304 Views
Learn about the importance of carbon monoxide as a primary air pollutant, its chemistry, detection methods like Cavity Ringdown and Tunable Diode Laser Spectroscopy, and sources of emissions. Discover MOPITT as a satellite sensor and global CO distribution.

E N D
Carbon MonoxideDetection AOSC 634 Russell R. Dickerson Finlayson-Pitts Chapt. 16 Seinfeld Chapt. 2 & 6 Wallace & Hobbs Chapt. 5 EPA 2000 Criteria Document: http://www.epa.gov/NCEA/pdfs/coaqcd.pdf EPA 2010 ISA: http://cfpub.epa.gov/ncea/cfm/recordisplay.cfm?deid=218686 1
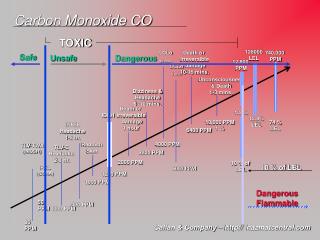
Carbon Monoxide • Importance • Primary Air Pollutant • Major sink for OH (greenhouse forcing, esp. short term!) • Thompson et al. (1989); Shindell et al. (2009); Hoor et al. (2009) • Source/Sink of O3 depending on NOx • Toxic air pollutant • Esp. for individuals with Coronary Artery Disease (EPA 2010) • Excellent tracer for combustion and dynamics. 2
In the remote atmosphere there is often insufficient NOx to drive this reaction to two O3; the process reduces OH. Globally, Thompson et al. (1989) predict that increased CO increases H2O2 and the ratio of HO2 to OH, but reduces OH. Reduced OH means a longer lifetime for CH4 and O3 which contribute to global warming, e.g., Shindell et al., (2009); EPA (2010)
Chemistry Carbon monoxide oxidation in a clean environment: (1) O3 + h O2 + O(1D) (2) O(1D) + H2O 2OH (3) OH + O3 HO2 + O2 (4) HO2 + O3 2O2 + OH ----------------------------------------- (3+4) 2O3 3O2 NET 4
Chemistry, continued Carbon monoxide oxidation in a dirty (polluted) environment: (3') OH + CO H + CO2 (4') H + O2 + M HO2 + M (5') HO2 + NO NO2 + OH (6') NO2 + h NO + O (7') O + O2 + M O3 + M ------------------------------------------------- (3'-7') CO + 2 O2 CO2 + O3 NET 5
Detection Methods • Cavity Ringdown • GC-FID • Hg Liberation (CO + HgO → CO2 + Hg↑) • Gas Filter Correlation NDIR • FTIR • Fluorescence • Tunable Diode Laser Spectroscopy • Remote sensing NDIR
Non-Dispersive Gas-Filter Correlation Detection of Carbon Monoxide 7
A TDL can be finely tuned to the precise wavelength that characterizes whatever chemical its users wish to detect. By measuring how much light has been absorbed, the TDL-based detector can determine how much carbon monoxide is present. The laser is tuned on and off a single rotational line around 4.6 mm to generate an AC signal. The signal is most easily seen as the second derivative.
MOPITT (Measurement of Pollution in the Troposphere): MOPITT is the first satellite sensor to use gas correlation spectroscopy. GCS is a non-dispersive technique to increase the sensitivity of the instrument to the gas of interest by separating out the regions of the spectrum where the gas has absorption lines and integrating the signal from just those regions. The specific wavelengths are located using a sample of the gas as a reference for the spectrum. By using correlation cells of differing pressures, some height resolution can be obtained. 11
MOPITT (Measurement of Pollution in the Troposphere) http://terra.nasa.gov/ 12
Sources Natural: Methane oxidation. Biogenic hydrocarbon (esp. isoprene) oxidation. Direct emission from plants and oceans, although plants may absorb CO as well as emit it. In any case, only direct emission is small relative to HC oxidation. Anthropogenic: Internal combustion engines emit CO, especially when they run rich. Even at a stoichiometric air/fuel mixture, CO is produced because of high-temperature dissociation of CO2. CO2 → CO + ½O2 CO + ½O2 → CO2H = -67.6 Coal combustion does not generate much CO because the power plants run lean in order to extract as much energy from the coal as possible. Biomass burning is a major source, as is oxidation of anthropogenic hydrocarbons in the presence of NOx. 14
Direct anthropogenic emissions only, based on the Mobile6 model. (EPA, 2009) 15
The global distribution of CO reflects the dominance of emissions in the Northern Hemisphere, the seasonal cycle of OH, and the short lifetime relative to transport across the ITCZ. 18
From the NOAA CMDL Trends Network Available almost real time. http://www.esrl.noaa.gov/gmd/ccgg/iadv/
CO/NOx ratio from observations indicates a ratio of ~6:1 (Luke et al., 2010).Emissions inventories (http://www.epa.gov/ttnchie1/trends/) indicate a ratio of 12:1.
References Bishop, G. A. and D. H. Stedman (2008), A decade of on-road emissions measurements, Environmental Science & Technology, 42, 1651-1656. Castellanos, P., L. T. Marufu, B. G. Doddridge, B. F. Taubman, S. H. Ehrman, and R. R. Dickerson (2010), Evaluation of Vertical Mixing and Emissions in the CMAQ Model Using Measured Vertical Profiles of CO and O3, J. Geophys. Res., in preparation. Hoor, P., J. Borken-Kleefeld, D. Caro, O. Dessens, O. Endresen, M. Gauss, V. Grewe, D. Hauglustaine, I. S. A. Isaksen, P. Jockel, J. Lelieveld, G. Myhre, E. Meijer, D. Olivie, M. Prather, C. S. Poberaj, K. P. Shine, J. Staehelin, Q. Tang, J. van Aardenne, P. van Velthoven, and R. Sausen (2009), The impact of traffic emissions on atmospheric ozone and OH: results from QUANTIFY, Atmospheric Chemistry and Physics, 9, 3113-3136. Hudman, R. C., L. T. Murray, D. J. Jacob, D. B. Millet, S. Turquety, S. Wu, D. R. Blake, A. H. Goldstein, J. Holloway, and G. W. Sachse (2008), Biogenic versus anthropogenic sources of CO in the United States, Geophysical Research Letters, 35. Hudman, R. C., L. T. Murray, D. J. Jacob, S. Turquety, S. Wu, D. B. Millet, M. Avery, A. H. Goldstein, and J. Holloway (2009), North American influence on tropospheric ozone and the effects of recent emission reductions: Constraints from ICARTT observations, Journal of Geophysical Research-Atmospheres, 114, DOI: 10.1029/2008JD010126 Kuhns, H. D., C. Mazzoleni, H. Moosmuller, D. Nikolic, R. E. Keislar, P. W. Barber, Z. Li, V. Etyemezian, and J. G. Watson (2004), Remote sensing of PM, NO, CO and HC emission factors for on-road gasoline and diesel engine vehicles in Las Vegas, NV, Science of the Total Environment, 322, 123-137, DOI: 10.1016/j.scitotenv.2003.09.013 Luke, W. T., P. Kelley, B. L. Lefer, and M. Buhr (2010), Measurements of primary trace gases and NOy composition in Houston, Texas, Atmospheric Environment, in press, DOI: 10.1016/j.atmosenv.2009.08.014. Marmur, A., W. Liu, Y. Wang, A. G. Russell, and E. S. Edgerton (2009), Evaluation of model simulated atmospheric constituents with observations in the factor projected space: CMAQ simulations of SEARCH measurements, Atmospheric Environment, 43, 1839-1849, DOI: 10.1016/j.atmosenv.2008.12.027. Novelli, P. C., K. A. Masarie, P. M. Lang, B. D. Hall, R. C. Myers, and J. W. Elkins (2003), Reanalysis of tropospheric CO trends: Effects of the 1997-1998 wildfires, Journal of Geophysical Research-Atmospheres, 108. Parrish, D. D. (2006), Critical evaluation of US on-road vehicle emission inventories, Atmospheric Environment, 40, 2288-2300. Shindell, D. T., G. Faluvegi, D. M. Koch, G. A. Schmidt, N. Unger, and S. E. Bauer (2009), Improved Attribution of Climate Forcing to Emissions, Science, 326, 716-718. Thompson, A. M., R. W. Steward, M. A. Owens, and J. A. Herwehe (1989), Sensitivity of tropospheric oxidants to global chemical and climate change, Atmos. Environ., 23, 519-532. Warneke, C., J. A. de Gouw, A. Stohl, O. R. Cooper, P. D. Goldan, W. C. Kuster, J. S. Holloway, E. J. Williams, B. M. Lerner, S. A. McKeen, M. Trainer, F. C. Fehsenfeld, E. L. Atlas, S. G. Donnelly, V. Stroud, A. Lueb, and S. Kato (2006), Biomass burning and anthropogenic sources of CO over New England in the summer 2004, Journal of Geophysical Research-Atmospheres, 111, DOI: 10.1029/2005JD006878. Yu, S. C., R. Mathur, D. W. Kang, K. Schere, and D. Tong (2009), A study of the ozone formation by ensemble back trajectory-process analysis using the Eta-CMAQ forecast model over the northeastern US during the 2004 ICARTT period, Atmospheric Environment, 43, 355-363. Yu, S. C., R. Mathur, K. Schere, D. W. Kang, J. Pleim, and T. L. Otte (2007), A detailed evaluation of the Eta-CMAQ forecast model performance for O-3, its related precursors, and meteorological parameters during the 2004 ICARTT study, Journal of Geophysical Research-Atmospheres, 112.
Take Home Messages • Carbon Monoxide is a relatively well understood trace gas with important roles in human health, the oxidizing capacity of the atmosphere and in global climate. • CO is a useful tracer for dynamical processed in the atmosphere such as convective mixing. • The uncertainty in the emissions is larger than can be explained by measurement uncertainty.