Download
1 / 10
100 likes | 248 Views
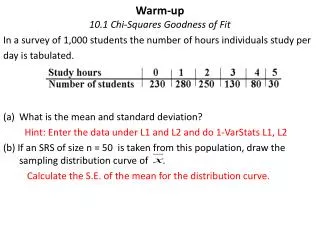
Warm-up 10.1 Chi-Squares Goodness of Fit. In a survey of 1,000 students the number of hours individuals study per day is tabulated. What is the mean and standard deviation? Hint: Enter the data under L1 and L2 and do 1-VarStats L1, L2

E N D
Warm-up10.1 Chi-Squares Goodness of Fit In a survey of 1,000 students the number of hours individuals study per day is tabulated. • What is the mean and standard deviation? Hint: Enter the data under L1 and L2 and do 1-VarStats L1, L2 (b) If an SRS of size n = 50 is taken from this population, draw the sampling distribution curve of . Calculate the S.E. of the mean for the distribution curve.
Chi-Squares and Goodness of Fit 10.1 Chi-Square Test Goodness of Fit Looking at Categorical Data 10.2 Chi-Square Test of Homogeneity Looking at Categorical Data with multiple variables 10.3 Chi-Square Test of Independence 11. 1 and 11.2 Inference for Regression Go back to Ch 8 for Inference on Proportions for 2 samples and back to Ch.9 for Inference of the mean for 2 samples
Important Dates Thursday April 26th we will finish inference and the multiple choice will be assigned from the cumulative test review. Monday April 30th we will review the answers to the multiple choice and finish and review the the free response. Wednesday May 2nd is the the day of the cumulative test. Monday May 7th the tests will be available for pick up and the answers to both forms will be posted on Sharepoint.
Analyzing Categorical Data Fortune magazine collected the astrological signs of 256 heads of the largest 400 companies. If the birth dates of the heads of large companies was uniformly distributed then we would expect 256/12 = Question: Are the zodiac signs of CEO’s distributed uniformly? Steps for a Chi –Square Test for Goodness-of-Fit. 1) Check conditions then state the test. 2) Write the hypotheses 3) Calculate Chi squared and the p-value. 4) Write a conclusion.
Step 1: Checking Conditions and Stating the Test - Counted Data Condition – data in each category had to be numerical - Randomization • Expected Cell Frequency – the expected data in each category has to be greater than 5 The conditions are satisfied so I’ll use X 2 model with 12-1 = 11 degrees of freedom and to do a chi-square goodness-of-fit test.
Step 2 and Step 3 Step 2: State the hypotheses Step 3: Calculate Chi-squared and P-value Χ2 = Sum (L5) P-Value: X 2cdf (X 2, UB, df) Draw Curve Y: X2pdf (X, 11) Zoom fit
and Graphs of X2 Step 4 : Conclusion Write the decision to reject or fail to reject the null hypothesis and base the decision on the P-value.
Another Example A Philadelphia newspaper report claims that 24.1% of 18 – to 24 – year-olds who attend a local college are from Delaware, 15.4% are from New Jersey, 50.7% are from Pennsylvania, and the remaining 9.8% are from other states in the region. Suppose that a random sample (size 150) of 18- to 24-year-olds is taken at the college and the number from each state/region is recorded. State Delaware New Jersey Pennsylvania Other Number of Students 30 39 71 10 These are the observed values! We need to calculate the expected.
Steps 1 - 3 Step 1: Check conditions and state the test. - Counted Data Condition - Randomization - Expected Cell Frequency Step 2: State Hypotheses. Step 3: Calculate Chi-Square and the P-value Χ2 = Sum (L5) P-Value: X 2cdf (X 2, UB, df) Draw Curve Y: X2pdf (X, 3) Zoom fit
Step 4 : Conclusion H.W. Read 10.1 and answer D #12 and 13 and E#4