Molybdenum Source Control
Molybdenum Source Control. Pretreatment Cause For Concern?. Eric De Berry City of Portland Bureau of Environmental Services Pacific NW Pretreatment Conference 2006. Molybdenum. Soft, Ductile, Refractory Metal with Melting Point of 4730 degrees F Usually Mined as Molybdenite (MoS2)


Molybdenum Source Control
E N D
Presentation Transcript
Molybdenum Source Control Pretreatment Cause For Concern? Eric De Berry City of Portland Bureau of Environmental Services Pacific NW Pretreatment Conference 2006
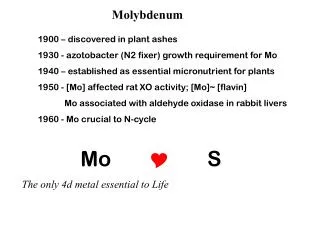
Molybdenum • Soft, Ductile, Refractory Metal with Melting Point of 4730 degrees F • Usually Mined as Molybdenite (MoS2) • Often Found in Association with Other Metal Sulfides (Particularly Copper) • Essential Metal for Plants and Animals • Average Daily Human Intake in Food is approx. 350 ug/Liter
Uses For Molybdenum • As an Alloying Element for Elevated Temperature Strength, Hardness, and Corrosion Resistance • Oil Rig Drill Stem Tubing • Catalyst for Sulfur Removal From Crude Oil, Natural Gas, and Coal
Additional Uses for Molybdenum • Lubricant Additive • Cooling System Corrosion Inhibitor • Paint Pigments • Smoke Suppressants • Catalysts
Molybdenum Toxicity • No fatalities were reported among animals that ingested amounts of molybdenum disulfide in doses as great as 6,000 mg Mo/kg (Fairhall et al.1945) • No changes were observed in rats over a 4 week period following inhalation exposures to metallic Mo at 25,000 to 30,000 mg/m3 for 1 hour (FDA 1975)
Biosolids Toxicity • Pastures Containing 20 to 100 ppm Molybdenum May Cause Diarrhea and Poor Growth Rate in Cattle and Sheep • Prolonged Exposure has Led to Deformities in Joints • Easily Prevented by Adding Copper or Sulfate to the Animal’s Diet
Biosolids Pollutant Limits (40CFRPart503) EPA may propose a Mo PC limit for EQ Biosolids
Land Application ProgramClass B BiosolidsMolybdenum-2005 mg/kg
Madison Farms Site Life@150 lb PAN/ac 292 232 197 Site Life (Years) 112
Mo Applications by Compound • Molybdenum (as an alloy) • Molybdenum Trioxide - Pigment, catalyst, ceramic glazes, enamels • Ammonium Molybdate - catalyst for desulfurization & dehydrogenation of petroleum products • Sodium Molybdate - paint pigment, metal finishing, brightening, metal surface prep, corrosion inhibition • Molybdenum Disulfide – lubricant additive
Solubility of Mo Compounds • Mo - Insol. in Water, Sol. in H2SO4, HNO3 • MoS2 – Insol. In Water, Sol. In Oil • MoO3 – Somewhat Sol. In Water (0.49mg/l) • H4N2O3 – Water Sol. • MoNa2O4 – Water Sol.
Molybdenum Pretreatment • Most Coagulants/Precipitants are Ineffective • Electrocoagulation - Oil-soluble Mo • Iron Co-precipitation at Reduced pH (4.0 to 6.0)– Water-soluble Mo
Industrial Sources of Mo Permitted in Portland • Petroleum Recycling (lubricants, corrosion inhibitors) • Metal Finishing (sodium molybdate used in phosphatizing) • Alloy Casting (dissolved metals from neutralized acid baths) • Industrial Cooling Systems (corrosion inhibitors)
Who else is having a problem? • Mass. Water Resources Authority (MWRA) Greater Boston Area – EQ Biosolids had higher levels of molybdenum during summer months. • Jacksonville, Florida (JEA) - exceeded molybdenum ceiling level of 75 mg/kg. They estimated that 5.8 lbs/day were coming from cooling towers. Increased loading in summer. • Phoenix, Arizona (SROG) - elevated levels of molybdenum in their biosolids during the summer months.
Recent Moly News • April 2006 – EPA orders Ridgecrest CA to develop source control program to investigate discharge of metals to the sewer system. Ridgecrest applied sewage sludge containing 92 ppm of Mo to fields.
What did they do about it? • MWRA - Reduced Mo levels by 40% by encouraging use of alternative corrosion control agents. • JEA – Prohibited water treatment chemicals containing molybdenum from being discharged to the sanitary sewer. • SROG – Distributed BMPs encouraging product substitution with molybdenum-free chemicals.
E D Fan Cold Water Out Service Return F Basin B Cooling Tower Operation
Service Return Evaporation Blower Packing Service Out Basin Feed Drain Bleed Air Out Service Water Return Water spray Blower Tower Packing Meter Meter Overflow Air In Service Water Out Tower Basin Make-up Water (Feed) Drain Bleed Open Cooling Water System
Why Treat Cooling Water? • Scale Prevention – Evaporation increases the dissolved solids concentration • Prevent Biological Fouling – Biological growth reduces heat transfer efficiency and facilitates corrosion • Corrosion Prevention – Oxidation degrades metal components in the system
Fe+2+OH- OH- OH- Fe+2 OH- O2 O2 Fe(OH)2 2e- Corrosion Control Corrosion is an electrochemical reaction • Metal anion is lost to water solution • Electrons move to cathodic area • Hydroxyl ions are formed at the surface of the metal
Tower Make-up Heat Exch Circulating Pump Bleed Sensor Feed Pump Automated Cooling Water Management
3.6 mil 3.6 mil 2.2 mil Gals to Sewer 25 day residence time from influent to biosolids Mo Conc. in Biosolids vs Total Reported Monthly Cooling Tower Bleeds
Mo Conc. in Biosolids vs Total Reported Monthly Cooling Tower Bleeds 2.9 mil 2.2 mil 1.6 mil Gals to Sewer 25 day residence time from influent to biosolids
Mo Conc. in Biosolids vs Total Reported Monthly Cooling Tower Bleeds 1.9 mil 1.8 mil .9 mil Gals to Sewer 25 day residence time from influent to Biosolids
What Conclusions Can We Jump To ? • The most likely source of Mo in the biosolids is the discharge from cooling towers. • The highest loading occurs in the summer, w/ a 25 day lag from influent to biosolids. • Industrial sources have the potential to “spike” the loading. • Loading levels are likely to increase as new construction adds more cooling towers, and cooling water discharges increase.
What to do? • Wait 111 years. • Develop Inventory of Cooling Towers How many? What size? Who maintains them? What treatment chemicals are used? • Target largest towers for…BMPs, product substitution etc.