Download
1 / 56
560 likes | 736 Views
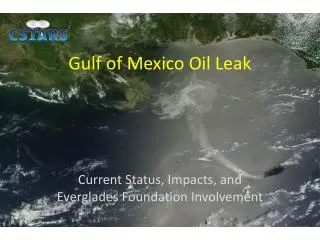
Acoustic Waveform Inversion of 2D Gulf of Mexico Data. Chaiwoot Boonyasiriwat April 13, 2009. Outline. Part I: Application of waveform inversion to marine data Part II: Resolution analysis using Beylkin’s formula. 1. Part I: Outline. Application of waveform inversion to marine data

E N D
Acoustic Waveform Inversion of2D Gulf of Mexico Data Chaiwoot Boonyasiriwat April 13, 2009
Outline Part I: Application of waveform inversion to marine data Part II: Resolution analysis using Beylkin’s formula 1
Part I: Outline • Application of waveform inversion to marine data • Motivation • Theory • Numerical Results • 2D SEG/EAGE Salt Model • Gulf of Mexico Data • Conclusions 2
Motivation True Model 0 Depth (km) 4500 4 Velocity (m/s) Waveform Tomogram 0 Depth (km) 1500 4 3 0 X (km) 16
The waveform misfit function is Theory of Waveform Inversion An acoustic wave equation: where 4
Theory of Waveform Inversion The steepest descent method can be used to minimize the misfit function: The waveform residual is defined by 5
Theory of Waveform Inversion where The gradient is calculated by 6
Part I: Outline • Application of waveform inversion to marine data • Motivation • Theory • Numerical Results • 2D SEG/EAGE Salt Model • Gulf of Mexico Data • Conclusions 7
2D SEG/EAGE Salt Model 4500 0 Velocity (m/s) Depth (km) 4 0 X (km) 16 1500 8
Initial Velocity Models 0 Depth (km) 4500 Traveltime Tomogram 4 Velocity (m/s) 0 Depth (km) 1500 v(z) Model 4 9 0 X (km) 16
Waveform Inversion Results Using Traveltime Tomogram 0 Depth (km) 4500 4 Velocity (m/s) Using v(z) Model + Flooding 0 Depth (km) 1500 4 10 0 X (km) 16
Waveform Inversion Results 4500 Velocity (m/s) True Model 0 Depth (km) 1500 4 10 0 X (km) 16
Flooding Technique Using v(z) Model w/o Flooding 0 Depth (km) 4500 4 Velocity (m/s) Waveform Tomogram after Salt Flood 0 Depth (km) 1500 4 11 0 X (km) 16
Flooding Technique Waveform Tomogram after Sediment Flood 0 Depth (km) 4500 4 Velocity (m/s) Waveform Tomogram using v(z) and Flooding Technique 0 Depth (km) 1500 4 12 0 X (km) 16
Part I: Outline • Application of waveform inversion to marine data • Motivation • Theory • Numerical Results • 2D SEG/EAGE Salt Model • Gulf of Mexico Data • Conclusions 13
Gulf of Mexico Data 480 Hydrophones 515 Shots dt = 2 ms Tmax = 10 s 12.5 m 14
Data Preprocessing (b) 0-15 Hz CSG (c) 0-25 Hz CSG 15
Adaptive Early-Arrival Muting Window Window = 1 s Window = 1 s 0-15 Hz CSG 0-25 Hz CSG 16
Adaptive Early-Arrival Muting Window Window = 2 s Window = 2 s 0-15 Hz CSG 0-25 Hz CSG 17
Traveltime Tomogram Results 0 Depth (km) 3000 2.5 Velocity (m/s) Waveform Tomogram 0 1500 Depth (km) 2.5 0 X (km) 20 18
3000 Waveform Tomogram 0 Velocity (m/s) Depth (km) 1500 2.5 Vertical Derivative of Waveform Tomogram 0 Depth (km) 2.5 19 0 X (km) 20
Comparing CIGs CIG from Waveform Tomogram CIG from Traveltime Tomogram 22
Comparing CIGs CIG from Waveform Tomogram CIG from Traveltime Tomogram 24
Comparing CIGs CIG from Waveform Tomogram CIG from Traveltime Tomogram 26
Part I: Outline • Application of waveform inversion to marine data • Motivation • Theory • Numerical Results • 2D SEG/EAGE Salt Model • Gulf of Mexico Data • Conclusions 27
Conclusions • Acoustic waveform inversion was applied to both 2D synthetic and field data • Using the traveltime tomogram, waveform inversion failed to converge to an accurate solution due to high velocity contrast • Using v(z) model with the flooding technique, an accurate result was obtained 28
Conclusions • Acoustic waveform inversion with a dynamic early-arrival muting window can invert the Gulf of Mexico data to obtain a velocity model that is more accurate than the traveltime tomogram. • The accuracy of waveform tomogram was assessed by comparing the migration images and common image gathers. 29
Part II: Outline • Spatial Resolution Analysis using Beylkin’s Formula • Motivation • Theory • Numerical Results • Homogeneous Model • Smoothed 2D SEG/EAGE Salt Model • Conclusions 1
Motivation Model with Resolution Limits RTM Image 2
Part II: Outline • Spatial Resolution Analysis using Beylkin’s Formula • Motivation • Theory • Numerical Results • Homogeneous Model • Smoothed 2D SEG/EAGE Salt Model • Conclusions 3
2D Spatial Resolution Formulas Given: source/receiver configuration and source frequency Find: spatial resolution limits Method: use a mapping function that maps the given information to resolution limits 4
2D Spatial Resolution Formulas • Why Beylkin’s resolution analysis? • It is simple • It can be used for heterogeneous media • It is fast -- ray-based method 5
2D common-shot gather can be described by Beylkin’s resolution mapping: data image 2D Spatial Resolution Formulas Source/receiver configuration can be described by coordinate 6
2D Spatial Resolution Formulas Beylkin et al. (1985) derived the following resolution formulas: where is the wavenumber vector in the image domain is the traveltime surface of a diffractor at r for shot/receiver pairs described by 7
Similarly, k can be written as vectorial sum 2D Spatial Resolution Formulas A diffractor traveltime can be described as where is the traveltime from surface position y to subsurface position x. 8
2D Spatial Resolution Formulas Horizontal and vertical resolution limits: 10
Part II: Outline • Spatial Resolution Analysis using Beylkin’s Formula • Motivation • Theory • Numerical Results • Homogeneous Model • Smoothed 2D SEG/EAGE Salt Model • Conclusions 11
Homogeneous Model Homogeneous Model with Resolution Limits 0 Depth (km) 1 1 0 X (km) 12
Homogeneous Model Reverse-Time Migration Image 0 Depth (km) 1 1 0 X (km) 14
Part II: Outline • Spatial Resolution Analysis using Beylkin’s Formula • Motivation • Theory • Numerical Results • Homogeneous Model • Smoothed 2D SEG/EAGE Salt Model • Conclusions 15
Smoothed SEG/EAGE Salt Model Smoothed Salt Model with Resolution Limits 0 6000 Velocity (m/s) Depth (km) 3.5 1500 0 X (km) 16 16
Smoothed SEG/EAGE Salt Model Reverse-Time Migration Image 0 Depth (km) 3.5 0 X (km) 16 18