Download
1 / 22
220 likes | 371 Views
Chapter 2 International tr ade in goods and services. Lecture plan. Changes in merchandise trade patterns changes in value, volume reasons for changes in trade composition processing trade intra-industry trade prices trends Services trade patterns changes in product composition

E N D
Lecture plan • Changes in merchandise trade patterns • changes in value, volume • reasons for changes in trade composition • processing trade • intra-industry trade • prices trends • Services trade patterns • changes in product composition • leading players 2<#>
World exports growth, by value (merchandise and services) Source: PRESS/401,14 April 2005 2<#>
Annual real growth rates of world merchandise exports and production, % Source:adaptedfrom WTOInternational Trade Statistics 2004 2<#>
International merchandise tradevalue vs volume (Table 2.1) • Value growth factors • physical demand • variations in international prices • product mix and product quality • exchange rates (‘the valuation effect’) • capital flows and trade policy • Volume growth • e.g. measured at constant prices and exchange rates • more realistic expression of trade growth 2<#>
Product composition of world merchandise exports, (% by product group) Source: adapted from GATT Annual Reports 1987–88, WTO International Trade Statistics 2004 2<#>
World manufactured exports as % of world merchandise exports, 1990, 2003 Source: adapted from WTO International Trade Statistics 2001 and 2004 2<#>
Recent trend: ‘processing trade’ • Preferential tariff duty-free access to those imports bound for processing and assembling of goods destined for exports • About 850 ‘export processing zones’ • Mixed success in expanding trade and employment • Value varies from US$0.7 billion in Bangladesh to US$104.6 billion in China • On the way down in NAFTA 2<#>
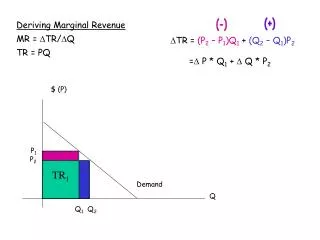
Recent trend: ‘intra-industry trade” • Exchange of the same category of products • T = 1 - I X - M I / (X + M) • Reasons • trade takes place in differentiated products • economies of scale (which require a limited range specialisation) 2<#>
Leading global exporters of services, 2003 (Fig. 2.4) Source: adapted from WTO International Trade Statistics 2004 2<#>
Leading services traders Eight of the top 10 exporters of services are also among the world’s top 10 exporters of goods (only Spain and Hong Kong are not) EU (15): about 40% of world trade in services US is largest individual exporter(16 %) and importer (12.5%) Share of developing Asian countries in world’s services exports up from <10% to about 15% - China, up by 17 places from 26 to 9 - Hong Kong, China and Spain (up 3 rankings each) 2<#>
International prices trends • Long-term downward trend in relative prices of most primary products • Consecutive declines of international manufactured prices over 1996–2001 • inflation receded worldwide to 1960s levels • office and telecom equipment: strong decline in prices, high exports volumes • firm US dollar over last years, which led to dollar price decline for those goods traded at nearly stable prices in depreciating currencies 2<#>
International prices trendscont • Prices of manufactured goods rose nearly 10% in 2003 (along with prices of farm products), the first annual increase since 1995. • Commodity prices and exchange rates changes led to a 10.5 strengthening of all internationally-traded goods in 2003. 2<#>
Terms of trade • Terms of trade index = export price index/ import price index x 100 - TTI > 100 favourable - TTI < 100 unfavourable - TTI = 100 unchanged 2<#>
Terms of trade index, 2001(1995 = 100) Source: adapted fromWorld Bank Development Indicators 2004, Table 4.4 2<#>
Share of world merchandise exports, by region, 1983, 2003 Source: adapted from WTO International Trade Statistics 2004 2<#>
Merchandise trade recovery in Asia (5)*, 1997–2000 * Indonesia, Korea Rep., Malaysia, Philippines Thailand Source: adapted from WTO data 2<#>
% Share of main regions in world merchandise imports, 1983, 2003 Source: adapted from WTO International Trade Statistics 2004 2<#>
Reasons for changes in trade patterns • Engel’s law • Price trends • Technological developments • Multinational enterprises • Regional trading blocks 2<#>
Merchandise and services as a percentage of world exports Source: adapted from WTO data 2<#>
Exports of commercial services by category, %, 1990, 2003 Source: adapted from WTO International Trade Statistics 2004 2<#>
Services trade in developing countries • Services—a protected sector • balance of payments considerations • support for indigenous providers of services • Arguments pro protection • indigenous firms are too weak • abrupt liberalisation would eliminate domestic firms • Arguments against protection • transfer of skills • more competition, better quality of service 2<#>