Reproducibility of Diffusion Tractography: Methods and Results Analysis
10 likes | 52 Views
This study evaluates the reproducibility of DTI tractography in healthy subjects, showcasing varied seed definition methods and their impact on reproducibility. Results indicate higher reproducibility with certain methods and suggest sample size implications. The study contributes valuable insights for planning clinical DTI studies.

Reproducibility of Diffusion Tractography: Methods and Results Analysis
E N D
Presentation Transcript
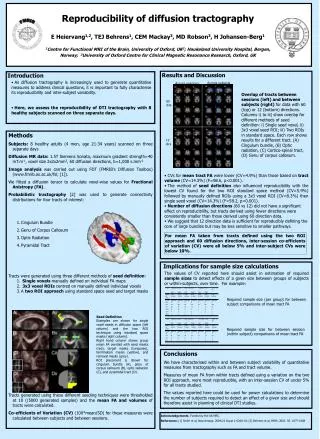
FMRIB Reproducibility of diffusion tractographyE Heiervang1,2, TEJ Behrens1, CEM Mackay3, MD Robson3, H Johansen-Berg11Centre for Functional MRI of the Brain, University of Oxford, UK2; Haukeland University Hospital, Bergen, Norway; 3University of Oxford Centre for Clinical Magnetic Resonance Research, Oxford, UK Results and Discussion Introduction • As diffusion tractography is increasingly used to generate quantitative measures to address clinical questions, it is important to fully characterise its reproducibility and inter-subject variability. • Here, we assess the reproducibility of DTI tractography with 8 healthy subjects scanned on three separate days. Across subjects Across sessions Overlap of tracts between sessions (left) and between subjects (right) for data with 60 (top) or 12 (bottom) directions. Columns i) to iii) show overlap for different methods of seed definition: i) Single seed voxel, ii) 3x3 voxel seed ROI; iii) Two ROIs in standard space. Each row shows results for a different tract. (A) Cingulum bundle, (B) Optic radiation, (C) Cortico-spinal tract, (D) Genu of corpus callosum. 60 dirs • Methods • Subjects: 8 healthy adults (4 men, age 21-34 years) scanned on three separate days • Diffusion MR data: 1.5T Siemens Sonata, maximum gradient strength=40 mT.m-1, voxel size 2x2x2mm3, 60 diffusion directions, b=1,000 s.mm-2 • Image analysis was carried out using FDT (FMRIB’s Diffusion Toolbox) (www.fmrib.ox.ac.uk/fsl; [1]). • We fitted a diffusion tensor to calculate voxel-wise values for Fractional Anistropy (FA). • Probabilistic tractography [2] was used to generate connectivity distributions for four tracts of interest: • Cingulum Bundle • Genu of Corpus Callosum • Optic Radiation • Pyramidal Tract • Tracts were generated using three different methods of seed definition: • 1. Single voxels manually defined on individual FA maps • 2. 3x3 voxel ROIs centred on manually defined individual voxels • A two ROI approach using standard space seed and target masks • Tracts generated using these different seeding techniques were thresholded at 10 (/5000 generated samples) and the mean FA and volumes of tracts were calculated. • Co-efficients of Variation (CV) (100*mean/SD) for these measures were calculated between subjects and between sessions. 12 dirs • CVs for mean tract FA were lower (CV=4.9%) than those based on tractvolume (CV=14.3%) (F=98.6, p<0.001). • The method of seed definition also influenced reproducibility with the lowest CV found for the two ROI standard space method (CV=5.9%) followed by manually defined ROIs using a 3x3 voxel ROI (CV=8.3%) then single seed voxel (CV=14.3%) (F=58.2, p<0.001). • Number of diffusion directions (60 vs 12) did not have a significant effect on reproducibility, but tracts derived using fewer directions were consistently smaller than those derived using 60 direction data. • We suggest that 12 direction data is sufficient for reproducibly defining the core of large bundles but may be less sensitive to smaller pathways. For mean FA taken from tracts defined using the two ROI approach and 60 diffusion directions, inter-session co-efficients of variation (CV) were all below 5% and inter-subject CVs were below 10%. Implications for sample size calculations The values of CV reported here should assist in estimation of required sample sizes to detect effects of a given size between groups of subjects or within-subjects, over time. For example: Required sample size (per group) for between subject comparisons of mean tract FA Seed Definition Examples are shown for single voxel seeds in diffusion space (left column) and the two ROI technique using standard space masks (right column). Right hand column shows group mean FA overlaid with seed masks (red), target masks (turquoise), termination masks (yellow), and removal masks (grey). ROI placement is shown for cingulum bundle (A), genu of corpus callosum (B), optic radiation (C), and pyramidal tract (D). Required sample size for between session (within subject) comparisons of mean tract FA Conclusions We have characterised within and between subject variability of quantitative measures from tractography such as FA and tract volume. Measures of mean FA from within tracts defined using a variation on the two ROI approach, were most reproducible, with an inter-session CV of under 5% for all tracts studied. The values reported here could be used for power calculations to determine the number of subjects required to detect an effect of a given size and should therefore assist in planning of clinical DTI studies. Acknowledgements. Funded by the UK MRC. References: [1] Smith et al, Neuroimage, 2004;23 Suppl 1:S208-19; [2] Behrens et al, MRM, 2003. 50. 1077-1088


