Download
1 / 47
470 likes | 566 Views
Rollercoaster Economics Financial Drivers In A Free-Falling Market Energy Focus. Dr. Jim Duncan June, 2009. CAUTIONARY STATEMENT FOR THE PURPOSES OF THE “SAFE HARBOR” PROVISIONS OF THE PRIVATE SECURITIES LITIGATION REFORM ACT OF 1995.

E N D
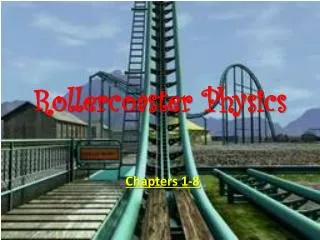
Rollercoaster Economics Financial Drivers In A Free-Falling MarketEnergy Focus Dr. Jim DuncanJune, 2009
CAUTIONARY STATEMENTFOR THE PURPOSES OF THE “SAFE HARBOR” PROVISIONSOF THE PRIVATE SECURITIES LITIGATION REFORM ACT OF 1995 The following presentation includes forward-looking statements within the meaning of Section 27A of the Securities Act of 1933, as amended and Section 21E of the Securities Exchange Act of 1934, as amended, which are intended to be covered by the safe harbors created thereby. You can identify our forward-looking statements by words such as “anticipates,” “expects,” “intends,” “plans,” “projects,” “believes,” “estimates,” and similar expressions. Forward-looking statements relating to ConocoPhillips’ operations are based on management’s expectations, estimates and projections about ConocoPhillips and the petroleum industry in general on the date these presentations were given. These statements are not guarantees of future performance and involve certain risks, uncertainties and assumptions that are difficult to predict. Further, certain forward-looking statements are based upon assumptions as to future events that may not prove to be accurate. Therefore, actual outcomes and results may differ materially from what is expressed or forecast in such forward-looking statements. Factors that could cause actual results or events to differ materially include, but are not limited to, crude oil and natural gas prices; refining and marketing margins; potential failure to achieve, and potential delays in achieving expected reserves or production levels from existing and future oil and gas development projects due to operating hazards, drilling risks, and the inherent uncertainties in interpreting engineering data relating to underground accumulations of oil and gas; unsuccessful exploratory drilling activities; lack of exploration success; potential disruption or unexpected technical difficulties in developing new products and manufacturing processes; potential failure of new products to achieve acceptance in the market; unexpected cost increases or technical difficulties in constructing or modifying company manufacturing or refining facilities; unexpected difficulties in manufacturing, transporting or refining synthetic crude oil; international monetary conditions and exchange controls; potential liability for remedial actions under existing or future environmental regulations; potential liability resulting from pending or future litigation; general domestic and international economic and political conditions, as well as changes in tax and other laws applicable to ConocoPhillips’ business. Other factors that could cause actual results to differ materially from those described in the forward-looking statements include other economic, business, competitive and/or regulatory factors affecting ConocoPhillips’ business generally as set forth in ConocoPhillips’ filings with the Securities and Exchange Commission (SEC), including our Form 10-K for the year ending December 31, 2006, as updated by our quarterly and periodic filings with the SEC. ConocoPhillips is under no obligation (and expressly disclaims any such obligation) to update or alter its forward-looking statements, whether as a result of new information, future events or otherwise.
High Prices Trigger Economic Slowdowns • Historically, a contraction of the economy leads to decline in energy demand • Lower industrial output • Home and commercial conservation • This time it’s different…many places are experiencing expansions • China • Europe • Russia • India • Industrial demand has increased over the past several months because the U.S. is more competitive, and specific gas-heavy industries such as ethanol and fertilizer have support.
Signs Of Long-Term Economic Problems Disposable Income Vs. Personal Savings Since 1987 Interest Paid Since 1987 Source: Bloomberg
The Difference By Next Year • Election Year Dynamics • Growth of environmental issues…longer term • Specific carbon regulations in Europe, general environmental concerns in emerging Asian economies, and anticipation of carbon legislation in the U.S. has tipped the balance from coal to gas • More news of supply than demand • Barnett Shale • Marcellus Shale
2008…12 Month Rollercoaster • Last year at this time… • Rigs fully employed • Forecasts were for increasing prices, increasing revenues, increased spending, increasing staffs… • Natural Gas was chasing $10, but well below historic highs. • Crude oil was trading between $100 and $110.
Then…VOLATILITY! • Crude Oil prices on the NYMEX spiked from $100 to $147 by early July. • That’s a spike of +53%! • The shock reverberated through September • Then Crude Oil prices succumbed to gravity and plunged 75% in 3 months.
Dow Industrial Average 1996-2008 14
Crude Oil Gasoline Dow Natural Gas Heating Oil When Crude Falls…
Crude Oil Was Symptomatic • The economy was long on its way to a “Blow-Off Top”. • Mortgage loans were just a symptom, too. • Easy credit increased the available cash, which increased spending, increasing credit, increasing spending… • Fiscal Responsibility…CNBC said that mortgage applicants could “Breathe on a mirror and if there was fog you could get a loan.” - CNBC
The Crude Oil Spike And The Collapse Were Asymmetric • The “spike” topped off a 15-fold increase from under $10 in 1998 to $147 in 2008 • The 3-month plunge took oil price back to where they were in November 2003. • The relatively high prices triggered increased productive capacity that has resulted in a massive oversupply in the current market.
The Great Experiment • Four areas of macroeconomic spending • Commercial • Import/Export • Consumer/Public • Government • Government looking to Japan and Great Depression • Nikkei hit 14,000 in 1990…never there again • Unemployment stayed above 10% for near 15 years.
The Profile Natural Gas Source: NYMEX
The Profile Crude Oil Source: NYMEX
The Profile Heating Oil Source: NYMEX
The Profile Gasoline Source: NYMEX
Zoom Into Last 12 Months Crude Oil Source: NYMEX
Zoom Into Last 12 Months Natural Gas Source: NYMEX
Fundamental Technical Sentiment Expectational Analysis
Supply / Demand(Im)balance Supply Demand
Supply Realities • Historically, there’s a 6 to 18 month lag before new supply reaches the market • Works the other way, too! • North American production decline rates are still averaging 30% • Shale production decline rates approach 70% • Current rig count translates into NEGATIVE YoY production rates…by the end of the year!
Where will we go next? High (In-Your-Face) The Flintstones Volatile Village ? Pace of technology change Low High ? Low (Little Influence) Business-As-Usual The Jetsons
It’s Hard Not To Be Bullish Energy Prices • Dollar at Risk • Demand from non-OECD countries • Oil price inelasticity • Historic comparisons • Peak Oil • Short time-frame flips in equilibrium • Inherent demand… • Weather • Critical Fall In Rig Count