Download
1 / 24
240 likes | 386 Views
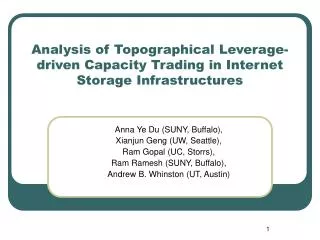
Analysis of Topographical Leverage-driven Capacity Trading in Internet Storage Infrastructures . Anna Ye Du (SUNY, Buffalo), Xianjun Geng (UW, Seattle), Ram Gopal (UC, Storrs), Ram Ramesh (SUNY, Buffalo), Andrew B. Whinston (UT, Austin). Summary of the Presentation.

E N D
Analysis of Topographical Leverage-driven Capacity Trading in Internet Storage Infrastructures Anna Ye Du (SUNY, Buffalo), Xianjun Geng (UW, Seattle), Ram Gopal (UC, Storrs), Ram Ramesh (SUNY, Buffalo), Andrew B. Whinston (UT, Austin)
Summary of the Presentation • The concept of Capacity Provision Networks (CPN) • Properties of CPN • Capacity discounting • Concavity of discounting • Empirical study on CPN properties • CPN operation • Capacity allocation • Surplus sharing
Content Providers Problem Context Internet Transit Connection Service Provider (SP) A Storage capacity Storage server to store the contents Demand Volatilities A’s Local market
Content Providers Bilateral Trading Internet Capacity utilized Excess of capacity Excess of capacity SP B Capacity for own use Shortfall solved SP A Shortfall of capacity Shortfall of capacity Peering Line Capacity for own use
Bilateral Trading with Intermediation SP C Capacity for A to use Capacity for own use Capacity for C to use Capacity for A to use Excess of capacity SP B Capacity for own use Capacity from C Capacity from B SP A Shortfall of capacity Capacity for own use
Trading in a CPN Capacity for own use SP C Excess of capacity SP B Capacity for own use Shortfall of capacity SP A Capacity for own use SP E Excess of capacity Shortfall of capacity SP D Capacity for own use Capacity for own use
Properties of CPN • Capacity discounting • Concavity of discounting
Content Providers Quality of Service Internet Storage server to store the contents SP i t0 Peering Line SP j Storage server to store the contents tr tc Average delay t2: Average delay t1:
Content Providers Capacity Discounting Internet Storage server to store the contents SP i t0 Peering Line SP j Storage server to store the contents tr To make average delay time unchanged: tc Define discount factor:
Concavity of Discounting • Generally, (t) is monotonically decreasing and concave. SP 2 SP 3 t1,2 t2,3 SP 1 t1,3 • Suppose t1,3 t1,2 + t2,3, then given the same t0, the discounting effect is convex 1,3 < 1,2·2,3 • If the concavity property holds, intermediated trading (123) is better than direct trading (13).
SP 1 SP 3 s* Topographical Arbitrage s*: allocation made available by SP 1 Trading without intermediation: 1,3·s* Trading with intermediation: 1,2·2,3·s*, where 1,3 < 1,2·2,3
Experiment • An Internet-based field experiment • Four simulated SP nodes Buffalo Seattle Connecticut Austin
Parameters Volatility Temporal Stability Size Stability Concavity Research Design A Longitudinal study of 5 months on a 24 x 7 basis 17,622 observations 12 discount factors Empirical Design • Empirical Model
Findings • The discount factors • More stable than network delays • Independent of hour of a day, or days in a work week • Concavity property exists
Local demand Information • ’s among the SPs • Subscribe Subscribe • MM hub • Allocation plan • Sharing plan • SP • SP • SP • SP A Market Maker (MM) Mechanism for Cooperative Capacity Trading • Allocation Plan • Centralized approach global optimization • Linear programming (LP) • Sharing Plan • Global surplus individual participants • Cooperative games • Shapley values (fair and equitable allocation) [Mas-Colell et al, 1995]
MM LP Model for Allocation To minimize the total penalty Total capacity provided by i should be equal to its available capacity Demand nodesshould never buy more than what is required Supply nodesshould never face a shortfall Nonnegativity constraint
Surplus Sharing using Shapley Values • Consider any subset K N. Let denote the optimal sharing plan under the MM model on the subset K only. • Define subset surplus • Shapley value for SP i is i’s expected value of marginal contribution to a permutation of N (there are N! permutations.) • Shapley value-based surplus sharing induces truth telling • Direct computation of Shapley value is of exponential order -O(2N)
Heuristic Algorithm – Sequential Permutation Sampling The changes of sample means and var. > a small positive number Regard each SP’s marginal contributions in the N! permutations as a population No Select initial sample size m Generate m random permutations of the N SPs Yes Compute the marginal contributions of each SP in each permutation Increase sample size from m to m+1 Compute the sample means and var. of the marginal contribution of each SP Use the sample means of marginal contributions to estimate Shapley values
Positive Network Effect The average surplus per SP exhibited a strong upward trend.
Computational Efficiency of the Heuristic Algorithm The sample sizes required, even for large networks, are fairly small
Quality of Heuristic Allocation Vast majority of the estimated Shapley values are within 20% of the true Shapley values.
Stability of the Solutions The estimated Shapley values are relatively stable to the sample that is drawn.
Convergence of the Estimator The cumulative estimated Shapley values converge to the cumulative true Shapley values over time.
Next Steps • Extension of CPN to Distributed Computational Economics (DCE) • Topographical leveraging in different service domains • Decentralized mechanism design • Marketplace architecture