Download
1 / 21
330 likes | 677 Views
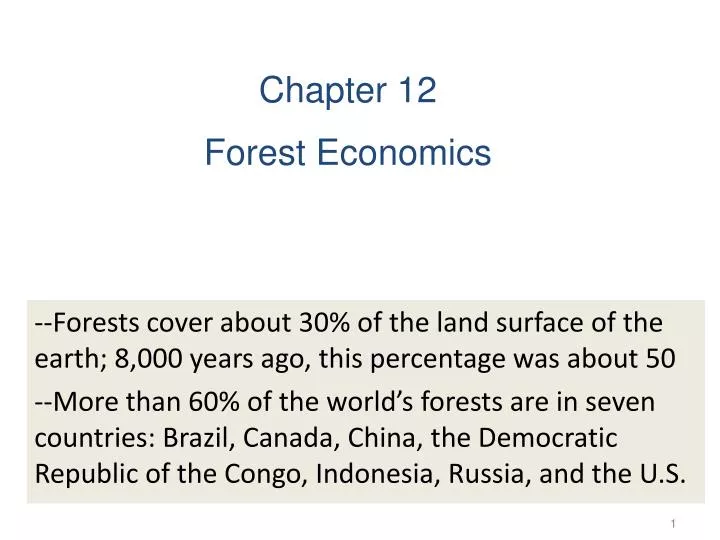
Chapter 12 Forest Economics. --Forests cover about 30% of the land surface of the earth; 8,000 years ago, this percentage was about 50 --More than 60% of the world’s forests are in seven countries: Brazil, Canada, China, the Democratic Republic of the Congo, Indonesia, Russia, and the U.S.

E N D
Chapter 12 Forest Economics --Forests cover about 30% of the land surface of the earth; 8,000 years ago, this percentage was about 50 --More than 60% of the world’s forests are in seven countries: Brazil, Canada, China, the Democratic Republic of the Congo, Indonesia, Russia, and the U.S.
The Major Problems Encountered in Managing the World’s Forest Resources • The challenging of maintaining production of traditional forest outputs in keeping with expanding populations and economies • The shift in many developed countries from traditional types of forest uses to new forms of uses (outdoor recreation) • The identification, valuation, and preservation of new types of forest services (biodiversity production, carbon sequestration, ecosystem protection…) • The pressure to convert forest land to other types of land use (subsistence and commercial agriculture) in developing countries
1. Forest Harvest Decisions • The objective of the community is to manage its forest land (when to cut a tree) so as to maximize the sustainable value of the timber harvest • Table 12-1 and Figure 12-1, page 222 • The total quantity of wood grows modestly for the first several decades, rapidly in the 3rd through 5th decades, slowly in the 6th and later decades (growth rate becomes zero at an age of about 100 years) • Periodic thinning/fertilizing can increase the production of wood
Table 12-1 and Figure 12-1, page 222 (con’t) • If we simply maximize the amount of wood obtained at the time of harvest, we need to delay harvest until the forest achieves its maximum volume, around year 100 • If we cut at 60 years when the average yield is the highest, it would yield the largest volume of any cycle (over 600 years, this would yield _________ cubic feet, as against a 100-year cycle which would yield 12,540 cubic feet)–the maximum sustainable yield (MSY)for the forest
Timber Harvest Rotation • Figure 12-2, page 223 • A rotation is a recurrent length of time, in years, between successive harvests of the same piece of land • A 60-year rotation means that the typical acre of timber is harvested every 60 years • Harvests are made at t, 2t, 3t, and so on; each harvest yields q cubic feet of timber
Identifying the Optimal Rotation Interval (t) • We select any two consecutive years • V0: the monetary value of the wood that would result if the forest were harvested this year • V1: the monetary value of the wood that would be produced if the harvest is delayed one year • C: harvest costs, the monetary costs of felling the trees and getting them to market • S: the present value of the vacant site after the trees have been harvested (p.224) Peter Berck http://are.berkeley.edu/~pberck/
Net proceeds in year 0 = V0 – C + S • Net proceeds in year 1 = V1 – C + S = V0 + ΔV – C + S where ΔV is the value of 1-year growth • When the forest is young and ΔV is relatively large, we should wait to harvest until next year since (V0 + ΔV – C + S)/(1+r) > (V0 – C + S) • As the forest gets older and ΔV is small, it is time to harvest the trees! At this time, (V0 + ΔV – C + S)/(1+r) = (V0 – C + S)
(V0 + ΔV – C + S)/(1+r) = (V0 – C + S) V0 + ΔV – C + S = (V0 – C + S) (1+r) V0 + ΔV – C + S = V0 – C + S + (V0 – C + S)r ΔV = (V0 – C + S)r ΔV = (V0 – C)r + Sr Figure 12-3, page 225: the optimal rotation is identified by the intersection of two functions, labeled as t* on the horizontal axis
$ time (years) ΔV (=MB) (V0 - C + S)r (=MC) s0 0 t*
(1) Portfolio Choice • ΔV = (V0 – C + S)r • This is an asset portfolio statement: r can be interpreted as the rate of return obtainable on general productive assets in the community; the right side is the rate of return we expect if we let the tree stand for another year • A rule: maintain the trees as long as the rate of return from doing so exceeds the rate of return on alternative assets. Otherwise, harvest the trees and replant
(2) Factors Affecting Efficient Rotation • (a) Suppose that harvesting costs (C) increased when a nearby logging mill closed and made it necessary to ship the logs a further distance • C appears on one of the two functions with a minus sign. The impact of the increase in C is to shift the (V0 – C + S)r function downward, thereby lengthening the optimal rotation period (p.225) • (b) If the interest rate were to fall in the long run, • This would shift the r(V0 – C + S) function _________ (p.225), indicating that the optimal rotation would get ________
(3) Impacts of Nontimber Forest Values • (a) One major service provided by forests is animal habitat. The required habitat for spotted owl is forest that consists of old trees (Figure 12-4, p.227: value for old trees is big) • This would push out the ΔV function (the new function is ΔV + H; H is annual value of the forest as owl habitat) and increase the optimal rotation
(b) Another nontimber value provided by forests is carbon sequestration • Two courses of action which can sequester more carbon are: convert land in other uses into forest land; and manage existing forest land to increase the amount of carbon sequestered • If the timber is harvested and converted into building materials, the carbon stays sequestered until the materials decay. The market values of timber = the value of timber for carbon storage + the value of timber as building materials. This higher timber price will increase ΔV, V0, and S and shift the ΔV function and the r(V0 – C + S) function outward. The optimal rotation could shift either to the right or to the left, or remains the same
$ time (years) ΔV (=MB) (V0 - C + S)r (=MC) s0 0 t* t’ Conclusion: t increases
$ time (years) ΔV (=MB) (V0 - C + S)r (=MC) s0 0 t*= t’ Conclusion: t remains unchanged
$ time (years) ΔV (=MB) (V0 - C + S)r (=MC) s0 0 t* t’ Conclusion: t decreases
Clear Cutting • The practice of harvesting all the trees in a particular area, as opposed to selective cutting based on certain criteria (species, size, age……); widely practiced in commercial forestry • Proponents point to harvesting cost savings and the advantages of promoting commercial forests that have trees of uniform characteristics • Opponents cite damages in terms of aesthetics, ecological integrity, watershed destruction, and reduced values for outdoor recreation
2. Institutional Arrangements for Forestry • In the United States, commercial forest production is from private lands (a large part is industrial forest land), nonindustrial timber land (timber output is not necessarily the primary goal), and public lands (decisions on harvesting are made by public agencies—the U.S. Forest Service)
3. Timber Harvesting from National Forests • The national forest system of the United States: was begun in the late 19th century; 191 million acres now • Figure 12-7, p.233: little wood was harvested from national forests in the first half of the 20th century; timber sales rose (after WWII) to a peak in the early 1970s, dropped a lot after around 1990 due to an increase in the demand for services such as outdoor recreation and ecosystem protection relative to the demand for harvested timber of the traditional sort
Review of slide 4 (MSY) • slope of ray = average volume (column (3), p.222) • slope of tangent = annual increase or marginal growth (column (4), p.222) • Through the origin, draw a ray that is tangent to growth function. It has the maximum average volume (27.7 cu ft/yr) which equals marginal growth (30 cu ft/yr), in year 60 (MSY) • This yields the largest volume over 600 years
Review of slides 6-8 (optimal rotation interval t*) • We maximize the present value of net benefits of the forest with respect to the time period of harvest • We wait to harvest until next year • We harvest when (V0 + ΔV – C + S)/(1+r) = (V0 – C + S) ΔV = (V0 – C + S)r MB of waiting (value of new growth) = MC of waiting (lost interest on total revenue or net benefits)