Download
1 / 54
540 likes | 551 Views
This analysis explores the use of proteomic patterns in serum to detect ovarian cancer at an early stage, offering potential for improved diagnostic accuracy and better patient outcomes.

E N D
Analysis of the Human Serum Proteome Dr. Timothy D. Veenstra Director, Laboratory of Proteomics and Analytical Technologies and NCI-Frederick Biomedical Proteomics Program
Challenge Goal: Eliminate Suffering and Death Due to Cancer by 2015. Dr. von Eschenbach, Director National Cancer Institute TRANSLATIONAL RESEARCH • Take research from the bench to bedside. • Obligation to public health. • Allow physicians to make better decisions in • cancer management.
If detected at an early stage, the five-year survival rates for most cancers is high even using currently available treatments. There is a need for biomarkers and novel diagnostic technologies that are more accurate and can detect early stage cancers. Three Keys to Translational Cancer Research • Early Detection • Development of improved proteomics and bioinformatic tools for diagnostic medicine. • Molecular Diagnostics • New Target Discovery (Global Proteomics) • Signal Transduction Pathway Profiling (Targeted Proteomics) • Molecular Targeted Therapeutics • Implementation of new technologies to ongoing NCI-based clinical trials.
ACTUAL WITH EARLY DETECTION 0 5 0 1 0 0 1 0 5 7 5 7 I II III IV 5 0 I II III IV 5 2 5 2 0 0 The Importance of Early Detection of Ovarian Cancer % 5 YR SURVIVAL % STAGE DISTRIBUTION A SHIFT IN NUMBER OF PATIENTS DIAGNOSED AT EARLY STAGE WILL DRAMATICALLY EFFECT PATIENT SURVIVAL!
Current Status of Ovarian Cancer Screening CA 125: a high-molecular-weight glycoprotein. CA 125 is elevated in 83% of patients with ovarian cancer. False Negative rates of 40-50% for stage I disease. CA-125 cannot be detected in tissue sections from 20% of ovarian cancers. Hence, the false negative rates using CA-125 will never be lower than 20%.
Patterns of Proteomic Information in Serum Hypothesis: 1. Signature proteins are products of the tumor-host microenvironment, and thereby unique to the tissue site and pathophysiological state. 2. These biomarkers are likely to be modified or cleaved “reporter” proteins/peptides that are produced/amplified at the tumor/host interface, are released, and partition to circulating carrier proteins. Tissues are continuously perfused by serum -- their histopathology may be reflected in serum proteomic “patterns.” Perfused Tissue
Pathologic Signature? Patterns of Proteomic Information in Serum “Proteomic” Mass Spectrum CAN PROTEIN PROFILING IDENTIFY PROTEIN EXPRESSION PATTERNS DIAGNOSTIC OF INVASIVE EPITHELIAL OVARIAN CANCER?
Hydrophobic Cation Exchange Anion Exchange Metal Affinity Normal Phase Antibody - Antigen Receptor - Ligand DNA - Protein PS-10 or PS-20 SELDI-TOF MS Diagnosis m/z Proteomic Pattern Pattern Recognition Serum Proteomic Pattern Diagnostic Workflow Serum Protein Chip
Application and Implementation of SELDI-QqTOF for Diagnostic Proteomics WCX2 ProteinChip Array ABI QSTAR Pulsar QqTOF MS Ciphergen SELDI-TOF MS More specialized knowledge required…? Limited m/z range? (5-12,000) Higher resolution (>9000 at m/z 1500) High mass accuracy (>50 ppm - external cal) Widely accessible Extensive m/z range (5-300,000) Low Resolution (~ 100-200) Low Mass Accuracy (~1000 ppm)
Bioinformatic Analysis for the Discovery of Diagnostic Patterns Phase I: Pattern Discovery Phase 2: Pattern Matching Test/validation sample for diagnosis a. Unaffected samples b. Cancer samples m/z m/z 1000 2000 3000 4000 5000 6000 1000 2000 3000 4000 5000 6000 Genetic algorithm + self-organizing cluster analysis Lead diagnostic fingerprint (from training set) Normal Cancer New “Survival of the fittest” discriminatory Patterns that discriminate “a” from “b” in the training set
Sample and Modeling Breakdown Samples obtained from National Ovarian Cancer Early Detection Program, Northwestern University (Director: Dr. David Fishman) A. 84 training samples (28 Unaffected and 56 Ovarian Cancer) B. 87 blind testing samples (30 Unaffected and 57 Cancer) C. 77 blind validation samples (37 Unaffected and 40 Cancer) Total: 153 Ovarian Cancer; 95 Unaffected
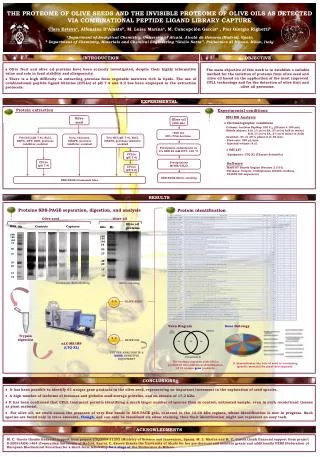
Metrics of “High Fitness” Models from QqTOF Data A. Results Breakdown of Four Models with Highest Diagnostic Accuracy State Testing Validation Normal 31/31 37/37 Ovarian Cancer 63/63 40/40 8600 8700 8500 Unaffected 5 4 • Key diagnostic features recognized within each model 7060 8606 Model 3 Model 4 Model 1 Model 2 0 0 7000 7100 7200 6900 m/z m/z Ovarian Cancer 7060 4 5 8606 8600 8700 0 0 8500 6900 7000 7100 7200 m/z m/z Results: 100% sensitivity; 100% specificity Conrads, T. P., Zhou, M., Petricoin, E, Liotta, L., and Veenstra, T. D., Expert Rev. Mol. Diagn., 3, 411-420.
Key diagnostic features recognized within each model Model 3 Model 4 Model 1 Model 2
BLINDED TEST RESULTS: Collaborators: Denise Ching, Kim Lyerly, Sam Wells, David Harpole; Duke U. Benign vs. Malignant (Spiral CT +) Key ion features selected (m/z) Specificity Sensitivity 6851.505 2378.046 2371.398 6675.697 10070.302 Pattern Recognition Method #1 69% 71% 2210.224 2620.747 4471.636 4914.232 5086.187 6649.053 6854.245 6854.456 Pattern Recognition Method #2 85% 98% 1028, 1035, 1050, 1289, 1980, 2080, 2210, 2212, 2365, 2366, 2485, 2589 2897, 3158, 3435, 3538, 3763, 4062, 4071, 4307, 4315, 4482, 4491, 4559 4643, 5138, 5139, 5800, 5861, 5879 6414, 6432, 6629, 6646, 6660, 6852 6978, 7834, 7835, 7908, 7922, 7923 7935, 7953, 8329, 8330, 8601, 8617 8619, 8634, 8913, 8931, 9120 Pattern Recognition Method #3 89% 95%
6820 6850 6880 100 Benign 50 2365 2370 2375 6820 6850 6880 0 1000.0 2000.0 3000.0 4000.0 5000.0 6000.0 7000.0 8000.0 9000.0 1.0e4 1.1e4 1.2e4 . 100 Adenocarcinoma Relative Intensity (%) 50 2370 2375 6820 6850 6880 0 1000.0 2000.0 3000.0 4000.0 5000.0 6000.0 7000.0 8000.0 9000.0 1.0e4 1.1e4 1.2e4 100 Squamous 50 2365 2370 2375 0 1000.0 2000.0 3000.0 4000.0 5000.0 6000.0 7000.0 8000.0 9000.0 1.0e4 1.1e4 1.2e4 m/z
6 4 % Relative Intensity 2 0 6835 6875 m/z
Do we detect clinical biomarkers such as CA125 or PSA in proteomic patterns using SELDI? Short Answer: No. Is this due to the sensitivity of the instrument? Short Answer: No, it is a dynamic range issue. A SELDI-TOF can detect below 10-12 mol/L. Will a straight MALDI approach and high resolution MS without specifically targeting PSA, for example, allow detection of these low abundant biomarkers? Short Answer: No (see above) Are we trying to detect PSA and CA125 Short Answer: No Do we need better ways of diagnosing early stage cancer beyond CA125 and PSA? Short answer: Absolutely. Are all of the steps necessary to make proteomic pattern diagnostics clinically useful being evaluated? Short answer: Absolutely.
Characterization of the Human Serum Proteome 22 PROTEINS COMPRISE 99% OF THE PROTEIN MASS IN SERUM! 90% 10%
Human Serum Proteomic Investigation Three tracks: Global serum proteome survey Can we account for the presence of histopathologically-related proteins/peptides in serum? Low molecular weight protein/peptide proteome Can we deplete the high molecular weight fraction for more effective interrogation of the source of the diagnostic information? Investigation of bound peptides to high abundant serum proteins Is there histopathological content bound to the highly abundant carrier proteins, such as albumin?
Global Serum Proteome Survey Ampholyte Free Serum Peptide IEF (20 Fractions) Tryptic Digest Analyze by LC/MS/MS Strong Cation Exchange (140 Fractions)
IEF/SCX 1143 Proteins 2071 Unique Peptides Total Proteins and Peptides Identified 1446 Unique Proteins 2649 Unique Peptides GLOBAL ANALYSIS OF THE SERUM PROTEOME bpp.nci.nih.gov IEF 473 Proteins 957 Unique Peptides Analysis of the Human Serum Proteome King C. Chan, David A. Lucas, Denise Hise, Carl F. Schaefer, Zhen Xiao, George M. Janini, Kenneth H. Buetow, Haleem J. Issaq, Timothy D. Veenstra and Thomas P. Conrads Clinical Proteomics (2004) In Press
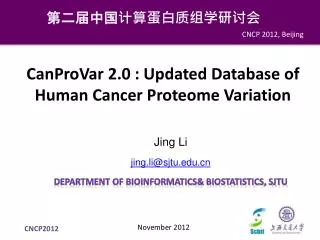
viral life cycle 0.04% antioxidant activity behavior transport 0.05% 0.54% 6.93% apoptosis regulator activity biological_process unknown transporter activity response to stress 2.43% 0.54% 2.94% 9.34% cell communication response to external stimulus transcription regulator activity 9.93% 7.76% 5.94% cell cycle pregnancy 2.36% 0.29% toxin activity pathogenesis 0.05% 0.47% cell growth and/ or maintenance surfactant activity 0.05% 13.31% binding activity structural molecule activity 34.07% metabolism 4.75% 19.43% cell motility 1.99% excretion 0.29% homeostasis 0.65% signal transducer activity 10.37% extracellular matrix organization cellular process 0.15% death 20.67% 1.81% diuresis protein tagging activity 0.04% circulation 0.91% 0.05% development digestion 6.85% protein stabilization activity 0.22% 0.05% cell adhesion molecule activity motor activity 2.86% 1.13% chaperone activity molecular function unknown 0.70% 3.46% cytoskeletal regulator activity enzyme activity enzyme regulator activity 0.05% 18.79% 2.86% defense/immunity protein activity 4.86% Analysis of Identified Human Serum Proteins Molecular Function Biological Processes
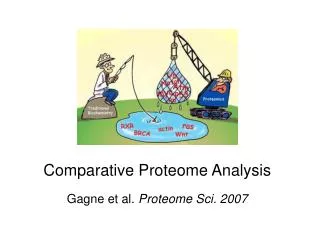
Membrane 30% Intracellular 47% Cellular Component of Human Serum Proteins Cytoplasmic 3% Cytoskeletal 3% cellular component unknown 7% virion Endoplasmic Reticulum 3% <1% Extracellular 8% Golgi 2% Lysosomal 1% Extracellular Mitochondrial 4% 15% Membrane 39% Nuclear 30% Intracellular 8% GO of Human Serum Proteome GO of Human Proteome
Key diagnostic features recognized within each model Model 3 Model 4 Model 1 Model 2 Human Serum Proteomic Investigation Three tracks: Global serum proteome survey Can we account for the presence of histopathologically-related proteins in serum? Low molecular weight protein/peptide proteome Can we deplete the high molecular weight fraction for more effective interrogation of the source of the diagnostic information? Investigation of bound peptides to high abundant serum proteins Is there histopathological content bound to the highly abundant carrier proteins, such as albumin?
Centrifuge High Molecular Weight Protein Depletion by Ultrafiltration Dilute raw serum 1:5 in 25 mM NH4HCO3, pH 8.2/20% acetonitrile 30 kDa MWCO Filter Tirumalai, R.S., Chan, K.C., Prieto, D.A, Issaq, H.J, Conrads, TP. and Veenstra, T.D. Mol. Cell Proteomics., (2003).
HSA 21.5 kDa 14.4 kDa 6.0 kDa 3.5 kDa LMW M Ultrafiltrate Raw Serum Ultrafiltrate Depletion of High MW Serum Proteins by Ultrafiltration Tirumalai, R.S., Chan, K.C., Prieto, D.A, Issaq, H.J, Conrads, TP. and Veenstra, T.D. Mol. Cell Proteomics., (2003).
MALDI-TOF MS of Ultrafiltered Serum Raw Serum 7.5 5 2.5 0 No Acetonitrile 7.5 Relative Intensity 5 2.5 0 20% Acetonitrile 7.5 5 2.5 0 2500 5000 7500 10000 12500 15000 m/z Tirumalai, R.S., Chan, K.C., Prieto, D.A, Issaq, H.J, Conrads, TP. and Veenstra, T.D. Mol. Cell Proteomics., (2003).
High Molecular Weight Protein Depletion by Ultrafiltration Dilute raw serum 1:5 in 25 mM NH4HCO3, pH 8.2/20% acetonitrile Centrifuge 30 kDa MWCO Filter Trypsin Digest SCX Fractionation mLC-MS/MS Tirumalai, R.S., Chan, K.C., Prieto, D.A, Issaq, H.J, Conrads, TP. and Veenstra, T.D. Mol. Cell Proteomics., (2003).
880 Unique Peptides (341 Proteins) Identified from Human Serum LOW MOLECULAR WEIGHT Fraction Hypothetical proteins Enzymes Circulating proteins Coagulation & complement factors Structural proteins, nuclear proteins, transcription factors, oncogene products, etc. Transport and binding proteins Protease Inhibitors Proteases Cytokines, Growth Factors, Hormones Channels, Receptors, Binding Proteins Tirumalai, R.S., Chan, K.C., Prieto, D.A, Issaq, H.J, Conrads, TP. and Veenstra, T.D. Mol. Cell Proteomics., (2003).
Function Compartment Protein Peptide Xcorr Charge Interferon g LKKYFNAG 2.48 2 extracellular defense/immunity 100 75 IEF/SCX IEF Relative Abundance (%) 50 1674 Unique Proteins 3441 Unique Peptides bpp-dev.nci.nih.gov 473 Proteins 957 Unique Peptides 1143 Proteins 2071 Unique Peptides 25 LMW 0 250 300 350 400 450 500 550 600 650 700 750 800 850 900 950 1000 m/z 308 Proteins 884 Unique Peptides GLOBAL ANALYSIS OF THE SERUM PROTEOME www.bpp.nci.nih.gov Materials and Methods Data Analysis
Serum Proteomic Analysis Three tracks: Global serum proteome survey Can we account for the presence of disease and cellular process-related proteins in serum? Low molecular weight protein/peptide proteome Can we deplete the high molecular weight fraction for more effective interrogation of the source of the diagnostic information? Investigation of bound peptides to high abundant serum proteins Is there histopathological content bound to the highly abundant carrier proteins, such as albumin?
Targeted Serum Proteomics • Utilize the character of serum – is the presence of albumin such a detriment, or is it something exploitable? • Can we target the proteomic study of serum for disease diagnosis as we would signal transduction pathways? • Diagnostic molecular sponges? • Preliminary diagnostic studies are demonstrating that highly abundant HMW proteins actually contain bound diagnostic information.
Protein G NH2 NH2 Lys Lys Dimethyl pimelimidate (DMP) Protein G Cl+H2N NH2+Cl C-(CH2)5-C OCH3 H3CO Bind Xlink Protein G Incubate Serum Wash Elute Protein G Protein G MALDI-TOF MS (Diagnostic) Centrifuge or Trypsin Digest/mLC-MS/MS (Discovery) 30 kDa MWCO
Serum interactionomics studies have been completed for: HSA via Antibody Capture IgG HSA via Dye-binding IgA Apolipoprotein IgM Transferrin Prostate specific antigen (PSA) was detected bound to IgG and albumin but not in the global serum analysis. Using high abundance proteins as sponges, may increase the likelihood of detecting low abundant proteins in serum or plasma.
295 195 AU 95 -5 0 15 30 45 60 75 90 Time (min) Global Analysis of the Mouse Serum Proteome Cation Exchange Anion Exchange 15 Intact Proteins 9 AU 3 -3 0 15 30 45 60 75 90 Time (min) Digest into Peptides Fractionate Using Strong Cation Exchange Compile Results Analyze by LC/MS/MS Analyze by LC/MS/MS
Extracellular 6.2% Membrane 43.8% Intracellular 47.5% Gene Ontology of Mouse Serum Proteome
5053 Unique Proteins 11113 Unique Peptides Global Analysis of the Mouse Serum Proteome Analysis and Bioinformatic Annotation is Continuing i.e. Comparison of mouse and human serum proteome Is mouse a reasonable model for studying human cancers?
Cross Comparison of Mouse and Human Serum Proteome Human Mouse Total Number of Proteins Identified 1674 5059 Proteins Mapped to Locus Link 1317 4637 Human/Mouse Pairs with >90% Similarity 165 166 Human/Mouse Pairs with >80% Similarity 240 244 Human/Mouse Pairs with >70% Similarity 385 401 Almost 30% of the human serum proteins identified had a homolog with >70% sequence similarity that was identified within the mouse serum proteome.
What About “One Hit Wonders” In Biomarker Discovery
9 (1.3%) 8 (1.9%) 10 (1.2%) 7 (2.6%) >10 (5.0%) 6 (3.3%) 5 (4.4%) 1 (45.6%) 4 (6.3%) 3 (10.3%) 2 (18.1%) Distribution of Unique Peptide Identifiers per Protein within Mouse Cortical Neuron Proteome In most global proteomic surveys and quantitative proteomic studies using ICAT, a large fraction of the peptides are identified by a single unique peptide.
Validation is a Key Component for Discovery-Driven Research ICAT-12/13C9 100 A C Q E Q I E A L L E S S L R y13 y12 y11 y10 y9 y8 y7 y6 y5 y4 y3 y2 Relative Abundance 50 S P Cyclin D1 0 81.0 82.0 83.0 84.0 85.0 Retention Time (min) Actin 100 13C9/13C0 ratio = 1.76 Densitometric ratio = 2.41 50 Relative Abundance 0 81.0 82.0 83.0 84.0 85.0 Retention Time (min)
Interstitial Cystitis and Antiproliferative Factor Interstitial cystitis (IC) is a debilitating chronic painful bladder disorder, of unknown etiology, from which approximately one million Americans suffer. Bladder epithelial cells from IC patients produce an antiproliferative factor (APF) that inhibits the proliferation of normal bladder epithelial cells in vitro and alters the production of specific growth factors. APF is a potential anti-bladder cancer agent, however, its identity is unknown.
Identification of Fraction with APF-activity 100 1 2 3 4 5 6 80 60 Relative Abundance (%) 40 20 0 0 10 20 30 40 Retention Time (min) 100 % 3H-Thymidine Incorporation 50 0 1 2 3 4 5 6 Fraction
MS of Fraction with APF-activity 100 X 80 Relative Abundance 60 40 Y 20 0 600 800 1000 1200 1400 1600 1800 2000 m/z 100 XIC m/z X XIC m/z Y 80 60 Relative Abundance (%) 40 20 0 0 10 20 30 40 Retention Time (min)
y6 ABC X X X X X X DEF b3 b4 b5 b6 b7 b8 Identification of APF by de novo Sequencing 100 80 60 Relative Abundance (%) 40 20 0 500 700 900 1100 1300 1500 100 80 60 Relative Abundance (%) 40 20 0 250 350 450 550 650 750 850 m/z