Download

1 / 29
290 likes | 458 Views
Bayesian Subgroup Analysis. Gene Pennello, Ph.D. Division of Biostatistics, CDRH, FDA Disclaimer: No official support or endorsement of this presentation by the Food & Drug Administration is intended or should be inferred. FIW 2006 September 28, 2006. Outline.

E N D
Bayesian Subgroup Analysis Gene Pennello, Ph.D. Division of Biostatistics, CDRH, FDA Disclaimer: No official support or endorsement of this presentation by the Food & Drug Administration is intended or should be inferred. FIW 2006 September 28, 2006
Outline Frequentist Approaches Bayesian Hierarchical Model Approach Bayesian Critical Boundaries Directional Error Rate Power Summary
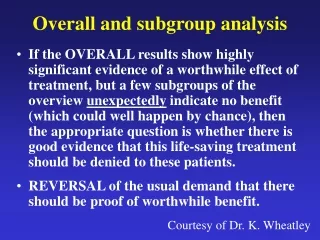
Frequentist Approaches Strong control of FWE Weak control of FWE Gatekeeper: test subgroups (controlling FWE) only if overall effect is significant Confirmatory Study: confirm with a new study in which only patients in the subgroup are enrolled.
Concerns with Frequentist Approaches Limited power of FWE procedures Powerlessness of gatekeeper if overall effect is insignificant Discourages multiple hypothesis testing, thereby impeding progress. Confirmation of findings, one at a time, impedes progress.
“No aphorism is more frequently repeated in connection with field trials, than that we must ask Nature few questions, or, ideally, one question at a time. The writer is convinced that this view is wholly mistaken. Nature, he suggests, will best respond to a logical and carefully thought out questionnaire …” Fisher RA, 1926, The arrangement of field experiments, Journal of the Ministry of Agriculture, 33, 503-513.
A Bayesian Approach Adjust subgroup inference for its consistency with related results. Choices Build prior on subgroup relationships. Invoke relatedness by modeling a priori exchangeability of effects.
Prior Exchangeability Model Subgroups: Labels do not inform on magnitude or direction of main subgroup effects. Treatments: Labels do not inform for main treatment effects. Subgroup by Treatment Interactions: Labels do not inform for treatment effects within subgroups.
Prior Exchangeability Model Exchangeability modeled with random effects models. Key Result: Result for a subgroup is related to results in other subgroups because effects are iid draws from random effect distribution.
Bayesian Two-Way Normal Random Effects Model Note: In prior distribution, Pr(zero effect) = 0 That is, only directional (Type III) errors can be made here.
Known Variances Inference Subgroup Problem: Posterior Note: In prior distribution, Pr(zero effect) = 0 That is, only directional (Type III) errors can be made here.
Bayes Decision Rule Declare difference > 0 if Let Note: In prior distribution, Pr(zero effect) = 0 That is, only directional (Type III) errors can be made here.
if Bayes Critical z Value Linear dependence on standardized marginal treatment effect ↑ with ↓interaction (↑ ) ↓with ↑ # subgroups b.
Full Interaction Case: Critical z value ↑ with ↓ true F ratio measuring heterogeneity of interaction effects. Bayes Critical z Value
No Interaction Case: Critical z value Power can be > than for unadjusted 5% level z test for subgroup if true F ratio measuring heterogeneity of treatment effects is large. Bayes Critical z Value
Directional Error Control Directional FDR controlled at A under 0-1-A loss function for correct decision, incorrect decision, and no decision (Lewis and Thayer, 2004). Weak control of FW directional error rate, loosely speaking, because of dependence on F ratio for interaction.
Comparisons of Sample Size to Achieve Same Power ULSD = 5% level unadjusted z test Bonf = Bonferonni 5% level z test HM = EB hierarchical model test
EX. Beta-blocker for Hypertension Losartan versus atenolol randomized trial Endpoint: composite of Stroke/ MI/ CV Death N=9193 losartan (4605), atenolol (4588) # Events losartan (508), atenolol (588) 80% European Caucasians 55-80 years old. http://www.fda.gov/cder/foi/label/2003/020386s032lbl.pdf
EX. Beta-blocker for Hypertension Cox Analysis N logHR SE HR (95% CI) p val Overall9193 .87 ( .77, .98) 0.021 Race SubgroupsNon-Black 8660 -.19 .06 .83 ( .73, .94) 0.003Black 533 .51 .24 1.67 (1.04,2.66) 0.033 Is Finding Among Blacks Real or a Directional Error?
EX. Beta-blocker for Hypertension Bayesian HM Analysis logHR se/sd HR (95%CI) p val Pr>0non-blackfrequentist -.19 .06 0.83 ( .73 .94) 0.003 0.001Bayesian -.18 .06 0.84 ( .74, .95) 0.003 blackfrequentist .51 .24 1.67 (1.04, 2.67) 0.033 0.983Bayesian .38 .27 1.47 (0.87, 2.44) 0.914Bayesian analysis cast doubt on finding, but is predicated on not expecting a smaller effect in blacks a priori.
Suggested Strategy Planned subgroup analysis Bayesian adjustment using above HM or similar model Pennello,1997, JASASimon, 2002, Stat. Med. Dixon and Simon, 1991, Biometrics
Suggested Strategy Unplanned subgroup analysis Ask for confirmatory trial of subgroup. Posterior for treatment effect in the subgroup given by HM is prior for confirmatory trial. Prior information could reduce size of confirmatory trial.
Summary Bayesian approach presented here considers trial as a whole, adjusts for consistency in finding over subgroups. Error rate is not rigidly pre-assigned Can vary from conservative to liberal depending on interaction F ratio and marginal treatment effect. Power gain can be substantial.Control for directional error rate is made only when warranted.
References Dixon DO and Simon R (1991), Bayesian subset analysis, Biometrics, 47, 871-881. Lewis C and Thayer DT (2004), A loss function related to the FDR for random effects multiple comparisons, Journal of Statistical Planning and Inference125, 49-58. Pennello GA (1997), The k-ratio multiple comparisons Bayes rule for the balanced two-way design, J. Amer. Stat. Assoc.,92, 675-684 Simon R (2002), Bayesian subset analysis: appliation to studying treatment-by-gender interactions, Statist. Med., 21, 2909-2916. Sleight P (2000), Subgroup analyses in clinical trials: fun to look at but don’t believe them!, Curr Control Trials Cardiovasc Med, 1, 25-27.
Other Notable References Berry DA, 1990, Subgroup Analysis (correspondence) Biometrics, 46, 1227-1230. Gonen M, Westfall P, Johnson WO (2003), Bayesian multiple testing for two-sample multivariate endpoints, Biometrics, 59, 76-82. Westfall PH, Johnson WO, and Utts JM (1997), A Bayesian perspective on the Bonferroni adjustment, 84, 419-427