Download
1 / 39
390 likes | 543 Views
Ocean Prediction and Predictability with Focus on Atlantic . Goal: Understanding ocean’s role in climate predictability from ISI to decadal scales using complex climate models

E N D
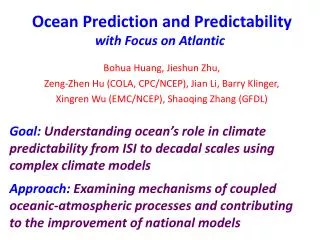
Ocean Prediction and Predictabilitywith Focus on Atlantic Goal: Understanding ocean’s role in climate predictability from ISItodecadal scales using complex climate models Approach: Examining mechanisms of coupled oceanic-atmospheric processes and contributing to the improvement of national models Bohua Huang, Jieshun Zhu, Zeng-Zhen Hu (COLA, CPC/NCEP), Jian Li, Barry Klinger, Xingren Wu (EMC/NCEP), Shaoqing Zhang (GFDL)
Outline Enhancing tropical simulation and initializationfor ISI predictability using NCEP Climate forecast System (CFS) Low cloud effect on CFS Bias Simulating diurnal SST variability Uncertainty of tropical Atlantic Heat Content (HC) variability • Understanding oceanic processes in North Atlantic for decadal predictability Mechanisms of multidecadal AMOC variability Improving Arctic climate in CFSv2
CFS Bias in Tropical Atlantic CFSv1 CFSv2 Does the lack of low cloud cause warm bias?
Hu et al. 2011, ClimDyn Realistic Low Cloud Reduces Bias Substantially SIM ERR OBS SIM LCLD LCLD ERR LCLD: Prescribed low cloud water content based on observations
Under more realistic mean state, equatorial seasonal transition is improvedSeasonal cycle along Equatorial Atlantic: SST and surface wind stress OBS LCLD SIM
Diurnal mixed layer (DML) enhances SST Variability TAO Mooring CFSv1 with DML CFSv1 without DML Total Total Total SST, Equator, 140oE Diurnal Diurnal Diurnal Li 2011, PhD diss.
Mean Diurnal SST Magnitude (Daily Maximum-Minimum) CFSv1 with DML parameterization Observation-based estimates (Clayson et al. 2007) Reconstructed DSST(Clayson et. al. 2007)
Zhu et al. 2011, ClimDyn, accepted Heat Content (HC) Uncertainty in Ocean AnalysesWhat happens to tropical Atlantic variability? 1979-2007 SNR Data Sources ECMWF: ORA-S3, COMBINE-NV NCEP: GODAS, CFSR UM/TAMU: SODA GFDL : CEDA HC=300m mean temperature
CFSR ECMWF How should we deal with high uncertainty in tropical Atlantic? Leading EOF modes from different ocean analyses show quite different features
Implication: Ensemble hindcasts from multiple ocean initial states may be the key for prediction in tropical Atlantic Ensemble mean improves the signal-to-noise ratio
Prediction Skill of Hurricane Main Development Region (MDR) Index (10-20N, 20W-80W) Ensembleaveraging of multiple ocean hindcasts has higher prediction skill “Rebound” occurs in SST prediction skill during hurricane season (SON) SST A M J J A S O N D J F M
Prediction Skill of MDR Index (10-20N, 20W-80W) “Rebound” of SST skill is due to re-emergence of sub-surface memory HC A M J J A S O N D J F M A M J J A S O N D J F M
Atlantic Meridional Overturning Circulation (AMOC) Potential source of predictability due to multi-year timescales associated with dynamics. • Multi-decadal oscillations in AMOC due to internal air-sea dynamics • Forced decrease in AMOC associated with global warming Confidence in potential to predict decadal variability in AMOC reduced by model-dependence of both these features. What causes the multidecadaloscillations? What determines the model dependence?
Multidecadal AMOC Oscillation Anything in common among models?
GFDL CM2.1 NCAR CCSM3.0 Phase1 GFDL CM2.1 and NCAR CCSM3 show similar AMOC evolution within a cycle Phase 2 Phase 3 Phase 4
Phase1 Phase 2 CM2.1 CCSM3.0 Phase 3 Phase 4 North Atlantic SST is increased following stronger AMOC
Phase1 Phase 2 CM2.1 CCSM3.0 Phase 3 Phase 4 North Atlantic HCA forces SSTA. Both are induced by AMOC heat transport
Phase1 Phase 2 CM2.1 CCSM3.0 Phase 3 Phase 4 Surface latent heat flux anomalies damp SSTA
Phase1 Phase 2 CM2.1 CCSM3.0 Phase 3 Phase 4 Strong AMOC induces sea ice melting
Phase1 Phase 2 CM2.1 CCSM3.0 Phase 3 Phase 4 The AMOC oscillation is associated with NAO
Phase1 Phase 2 CM2.1 CCSM3.0 Phase 3 Phase 4 Air temperature is warm after a strong AMOC
Observed multidecadal variability in North Atlantic sea level height Frankcombe and Dijkstra. GRL, 2009 East There is observational basis for 20-30yr variability in North Atlantic, faster than AMO West
Why do different CGCMs project different amounts of AMOC decline during 21st century? Much of variability in AMOC decline explained by variability in northern N Atl surface density decline. Most of the variability in N Atlsurface density decline is due to variability in salinity decline. density decrease fractional overturning decrease normalized surf. dens decrease S contribution T contribution solid symbols: total SRES A1B vs. 20C3M Klinger 2011, J Clim in review
Weak AMOC in CFSR initial condition (IC)? Initial month Final month
Strong initial AMOC in ECMWF IC is also weakened Initial month Final month
CFSR IC OBS ECMWF IC Model surface water is too fresh in North Atlantic
CFSR IC OBS ECMWF IC Considerable freshening occurs in upper 200 meters
Slid lines: CFSR IC Dashed lines: ECMWF IC Where does the excessive freshwater come from?
Sea Ice, ECMWF IC Artificial Sea Ice melting in Arctic Ocean could be a major source of freshwater flux into North Atlantic
Sensitivity Experiment Albedo (ICE) Run (10-yr) Sea Ice Albedo 0.8 (Control 0.6) Temperature range of albedo change from dry to wet ice 1.0oC (Control 10.0oC) Based on suggestions from Dr. Xingren Wu (EMC/NCEP)
Sensitivity Experiment Albedo (ICE) Run (10-yr) Sea Ice Albedo 0.8 (Control 0.6) Temperature range of albedo change from dry to wet ice 1.0oC (Control 10.0oC) Based on suggestions from Dr. Xingren Wu (EMC/NCEP)
ICE Run Sea Surface Salinity November Ice Run Brackish water from Baltic Sea may be another source of North Atlantic freshening It causes a serious freshening of the northeastern part of the North Atlantic Ocean
Sensitivity Experiment TOPO Run (10-yr): Sill depth between Baltic Sea and North Atlantic is raised from 100m (Control) to 30m The freshening in the eastern part of North Atlantic is reduced Sea Surface Salinity Difference TOPO-ICE
SummaryDeficit of low cloud is a major source of tropical Atlantic warm bias in CFSv1 and v2 Diurnal mixed layer parameterization generates realistic diurnal SST variability in CFSv1 and should also be helpful in v2 Current ocean analyses show high uncertainty in tropical Atlantic heat content variability; ensemble ocean initialization is necessary for tropical Atlantic predictionSome climate models produce a 20-30 yr oscillation in North Atlantic, which has observational basisand may be a source of decadal predictabilityExcessive freshening weakens AMOC in CFSv2; Arctic climate is improved by adjusting sea ice albedo and marginal sea outflowWork is ongoing in collaboration with NCEP scientists to improve CFSv2 simulation and to investigate predictability with these improvements