Download
1 / 67
670 likes | 725 Views
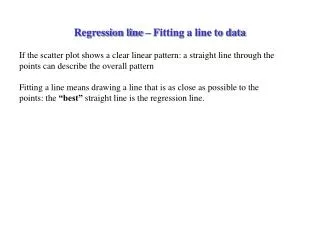
Fitting Equations to Data. Suppose that we have a single dependent variable Y (continuous numerical) and one or several independent variables, X 1 , X 2 , X 3 , ... (also continuous numerical, although there are techniques that allow you to handle categorical independent variables).

E N D
Suppose that we have a • single dependent variable Y (continuous numerical) and • one or several independent variables, X1, X2, X3, ... (also continuous numerical, although there are techniques that allow you to handle categorical independent variables). • The objective will be to “fit” an equation to the data collected on these measurements that explains the dependence of Y on X1, X2, X3, ...
Example Data collected on n = 110 countries Some of the variables Y = infant mortality X1 = pop’n size X2 = pop’n density X3 = % urban X4 = GDP Etc Our intersest is in determining how Y is related to X1, X2, X3, X4 ,etc
Equations give very precise and concise descriptions (models) of data and how dependent variables are related to independent variables.
Examples • Linear modelsY = Blood Pressure, X = age Y = a X + b + e
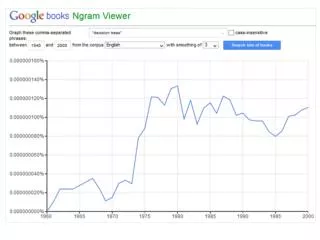
Exponential growth or decay models Y = Average of 5 best times for the 100m during an Olympic year, X = the Olympic year.
Note: the presence of the random error term (random noise). This is a important term in any statistical model. Without this term the model is deterministic and doesn’t require the statistical analysis
What is the value of these equations? • Equations give very precise and concise descriptions (models) of data and how dependent variables are related to independent variables. • The parameters of the equations usually have very useful interpretations relative to the phenomena that is being studied. • The equations can be used to calculate and estimate very useful quantities related to phenomena. Relative extrema, future or out-of-range values of the phenomena • Equations can provide the framework for comparison.
Again we assume that we have a single dependent variable Y and p (say) independent variables X1, X2, X3, ... , Xp. The equation (model) that generally describes the relationship between Y and the Independent variables is of the form: Y = f(X1, X2,... ,Xp | q1, q2, ... , qq) + e where q1, q2, ... , qq are unknown parameters of the function f and e is a random disturbance (usually assumed to have a normal distribution with mean 0 and standard deviation s).
In Multiple Linear Regression we assume the following model Y = b0 + b1 X1 + b2 X2 + ... + bp Xp + e This model is called the Multiple Linear Regression Model. Again are unknown parameters of the model and where b0, b1, b2, ... , bp are unknown parameters and e is a random disturbance assumed to have a normal distribution with mean 0 and standard deviation s.
The importance of the Linear model 1. It is the simplest form of a model in which each dependent variable has some effect on the independent variable Y. When fitting models to data one tries to find the simplest form of a model that still adequately describes the relationship between the dependent variable and the independent variables. The linear model is sometimes the first model to be fitted and only abandoned if it turns out to be inadequate.
In many instance a linear model is the most appropriate model to describe the dependence relationship between the dependent variable and the independent variables. This will be true if the dependent variable increases at a constant rate as any or the independent variables is increased while holding the other independent variables constant.
3. Many non-Linear models can be put into the form of a Linear model by appropriately transformation the dependent variables and/or any or all of the independent variables. This important fact ensures the wide utility of the Linear model. (i.e. the fact the many non-linear models are linearizable.)
An Example The following data comes from an experiment that was interested in investigating the source from which corn plants in various soils obtain their phosphorous. The concentration of inorganic phosphorous (X1) and the concentration of organic phosphorous (X2) was measured in the soil of n = 18 test plots. In addition the phosphorous content (Y) of corn grown in the soil was also measured. The data is displayed below:
Inorganic Phosphorous X1 Organic Phosphorous X2 Plant Available Phosphorous Y Inorganic Phosphorous X1 Organic Phosphorous X2 Plant Available Phosphorous Y 0.4 53 64 12.6 58 51 0.4 23 60 10.9 37 76 3.1 19 71 23.1 46 96 0.6 34 61 23.1 50 77 4.7 24 54 21.6 44 93 1.7 65 77 23.1 56 95 9.4 44 81 1.9 36 54 10.1 31 93 26.8 58 168 11.6 29 93 29.9 51 99
Coefficients Intercept 56.2510241 (b0) X1 1.78977412 (b1) X2 0.08664925 (b2) Equation: Y = 56.2510241 + 1.78977412 X1 + 0.08664925 X2
Assume we have taken n observations on Y: y1, y2, … , yn For n sets of values of X1, X2, … , Xp (x11, x12, … , x1p) (x21, x22, … , x2p) … (xn1, xn2, … , xnp) For any choice of the parameters b0, b1, b2, … , bp the residual sum of squares is defined to be:
The Least Squares estimators of b0, b1, b2, … , bp are chosen to minimize the residual sum of squares : To achieve this we solve the following system of equations:
Now: or
Also or
The system of equations for (n + 1) linear equations in (n + 1) unknowns These equations are called the Normal equations. The solutions are called the least squares estimates
The Example The following data comes from an experiment that was interested in investigating the source from which corn plants in various soils obtain their phosphorous. The concentration of inorganic phosphorous (X1) and the concentration of organic phosphorous (X2) was measured in the soil of n = 18 test plots. In addition the phosphorous content (Y) of corn grown in the soil was also measured. The data is displayed below:
Inorganic Phosphorous X1 Organic Phosphorous X2 Plant Available Phosphorous Y Inorganic Phosphorous X1 Organic Phosphorous X2 Plant Available Phosphorous Y 0.4 53 64 12.6 58 51 0.4 23 60 10.9 37 76 3.1 19 71 23.1 46 96 0.6 34 61 23.1 50 77 4.7 24 54 21.6 44 93 1.7 65 77 23.1 56 95 9.4 44 81 1.9 36 54 10.1 31 93 26.8 58 168 11.6 29 93 29.9 51 99
TheNormal equations. where
TheNormal equations. have solution:
Coefficients Intercept 56.2510241 (b0) X1 1.78977412 (b1) X2 0.08664925 (b2) Equation: Y = 56.2510241 + 1.78977412 X1 + 0.08664925 X2
The Least Squares Estimates: - the values that minimize
The Analysis of Variance Table Entries a)Adjusted Total Sum of Squares(SSTotal) b) Residual Sum of Squares(SSError) c) Regression Sum of Squares(SSReg) Note: i.e. SSTotal = SSReg +SSError
The Analysis of Variance Table Source Sum of Squares d.f. Mean Square F Regression SSReg p SSReg/p = MSReg MSReg/s2 Error SSError n-p-1 SSError/(n-p-1) =MSError = s2 Total SSTotal n-1
Uses: 1. To estimate s2 (the error variance). - Use s2 = MSError to estimate s2. • To test the Hypothesis H0: b1 = b2= ... = bp = 0. Use the test statistic - Reject H0 if F > Fa(p,n-p-1).
3. To compute other statistics that are useful in describing the relationship between Y (the dependent variable) and X1, X2, ... ,Xp (the independent variables). a) R2 = the coefficient of determination = SSReg/SSTotal = = the proportion of variance in Y explained by X1, X2, ... ,Xp 1 - R2 = the proportion of variance in Y that is left unexplained by X1, X2, ... , Xp = SSError/SSTotal.
b) Ra2 = "R2 adjusted" for degrees of freedom. = 1 -[the proportion of variance in Y that is left unexplained by X1, X2,... , Xp adjusted for d.f.]
c) R= ÖR2 = the Multiple correlation coefficient of Y with X1, X2, ... ,Xp = = the maximum correlation between Y and a linear combination of X1, X2, ... ,Xp Comment: The statistics F, R2, Ra2 and R are equivalent statistics.
Using Statistical Packages To perform Multiple Regression
Using SPSS Note: The use of another statistical package such as Minitab is similar to using SPSS
After starting the SSPS program the following dialogue box appears:
If you select Opening an existing file and press OK the following dialogue box appears
If the variable names are in the file ask it to read the names. If you do not specify the Range the program will identify the Range: Once you “click OK”, two windows will appear
To perform any statistical Analysis select the Analyze menu: